FIGURE.
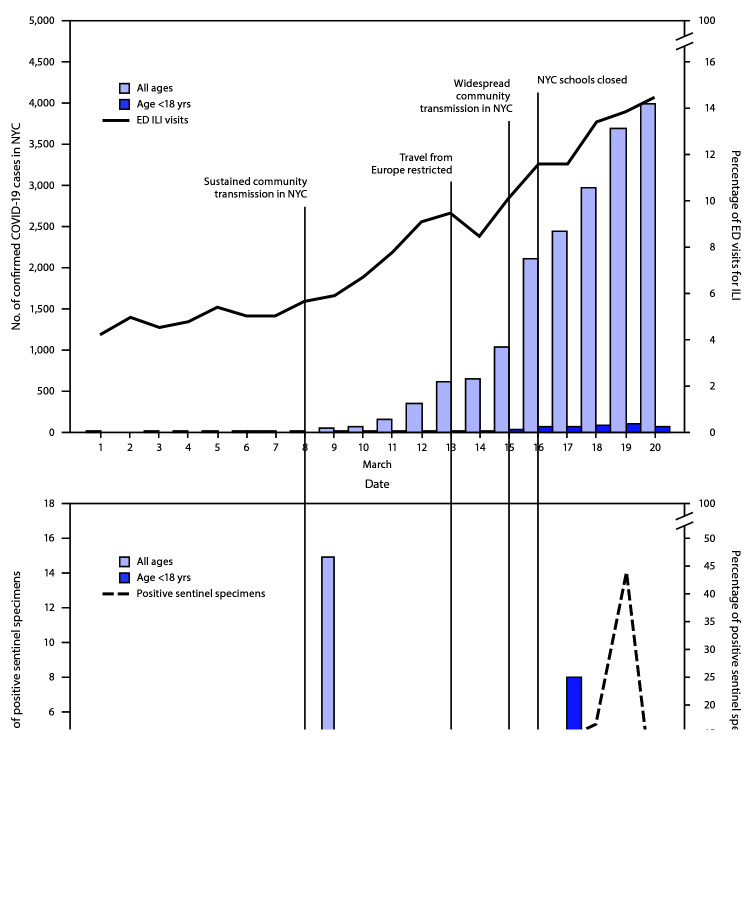
Daily percentage of emergency department (ED) visits for influenza-like illness (ILI), number of confirmed COVID-19 cases, and number and percentage of sentinel specimens positive for SARS-CoV-2* — New York City, March 1–20, 2020
Abbreviations: COVID-19 = coronavirus disease 2019; NYC = New York City.
* ED visits for ILI reported by date of visit, confirmed cases by date of diagnosis, and sentinel specimens by date of collection.

