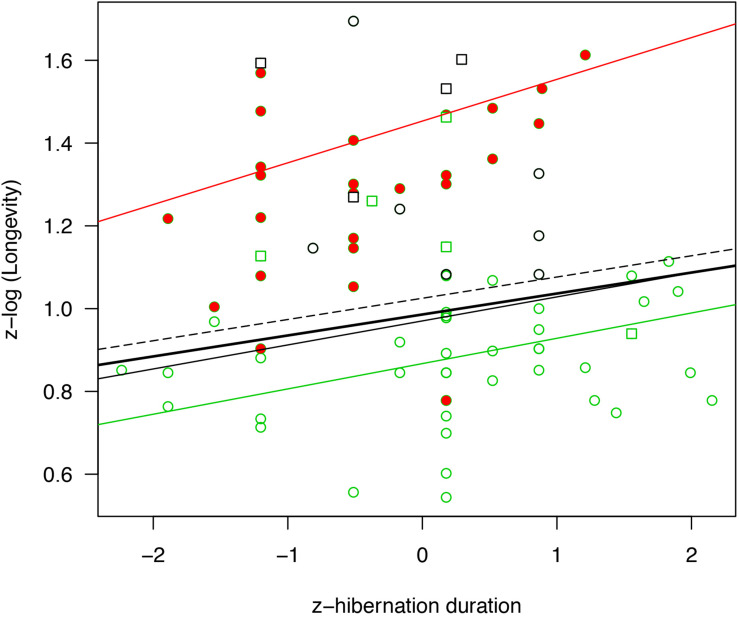
FIGURE 2.
Relationship between hibernation season duration (standardized) and longevity (log-transformed and standardized). The regression lines are presented for PGLS models for all mammals (bold black line, N = 82, p = 0.015), all hibernators without bats (black line, N = 55, p = 0.011), deep hibernators without bats (dashed line, N = 46, p = 0.028) and small hibernators without bats (green line, N = 44, p = 0.005). For comparison, effect sizes from a simple linear model not accounting for phylogeny are presented for bats only (red line, N = 27, p = 0.036). Full red circles highlight bat species, the squares highlight species reducing their energy expenditure during hibernation by less than 90% compared to the euthermic state, green item highlight species below 1.5 kg, and black circle highlight all remaining hibernators above 1.5 kg in the data set. Please note that some dots referring to bat species are superimposed because the corresponding species have the same hibernation season durations and longevities.

