
Fig. 1.
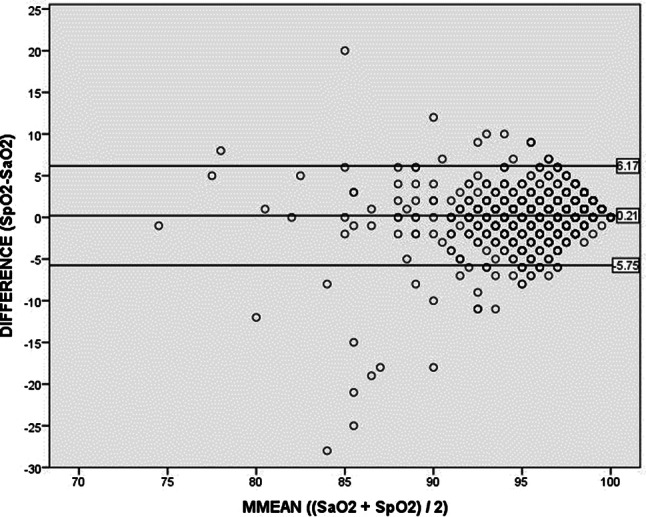
Bland–Altman plot, in which the difference between SpO2 and SaO2 is plotted against their average. The mean difference is 0.21% (middle line), with a SD (precision) of 3.04%. Limits of agreement were calculated using mean ± (1.96 * SD), resulting in an upper limit of 6.17% and a lower limit of − 5.75% (outer lines)