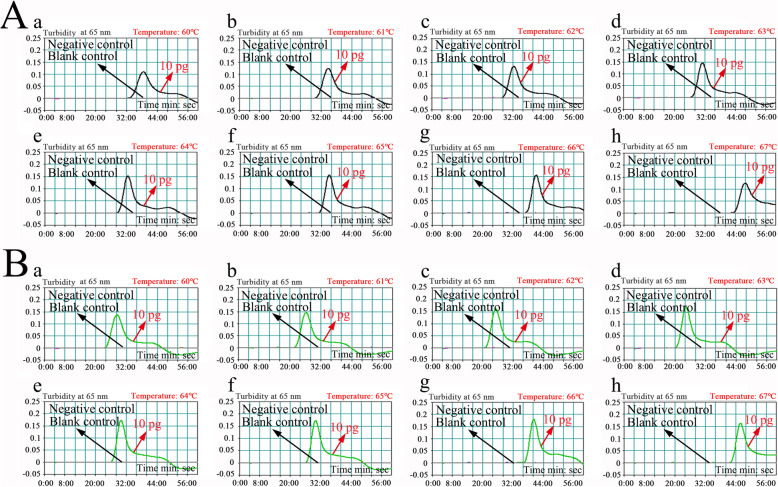
Fig. 3.
Optimization of amplification temperature for the femA-LAMP (a) and mecA-LAMP (b) primer sets. LAMP for the detection of femA (a) and mecA (b) was monitored through real-time turbidity, and the corresponding curves of DNA concentrations are displayed in the graphs. The threshold value was 0.1, and turbidity> 0.1 was considered positive. Mixtures with 10 pg of genomic DNA from P. aeruginosa (ATCC 27853) and E. faecalis (ATCC 29212) were used as negative controls (NCs), and 1 μl of double distilled water (DW) was used as a blank control (BC). Eight kinetic graphs were obtained at different temperatures (60–67 °C, 1 °C intervals) with 10 pg of target genomic DNA per reaction. a, The graphs from d (63 °C) to g (66 °C) showed robust amplification; b, the graphs from b (61 °C) to h (67 °C) showing robust amplification

