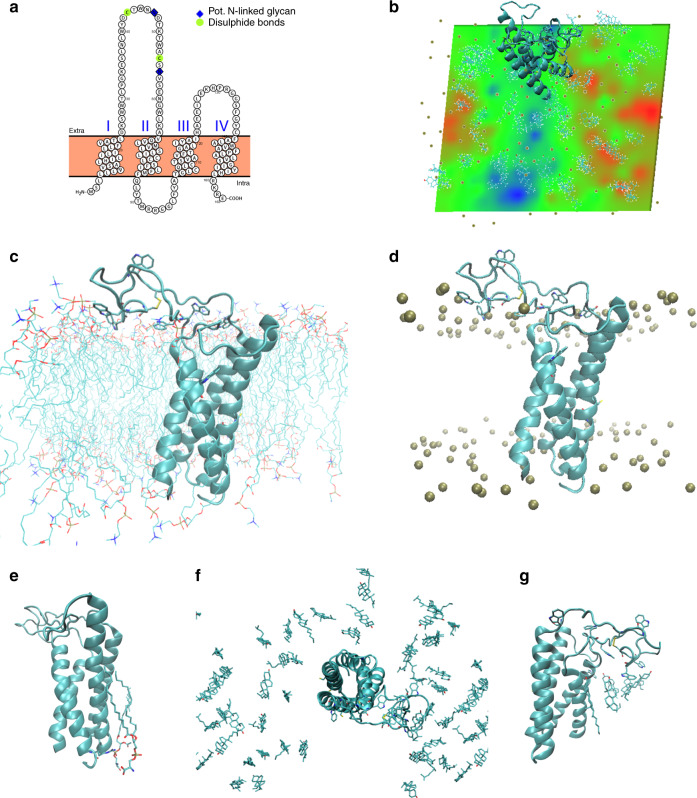
Fig. 4. Structural calculations and predications on membrane embedded EMP3.
a Homology modelling using PROTTER software. Proposed topology of EMP3 based on homology with claudin-19. I–IV represent transmembrane segments with both termini placed in the cytoplasm. Proposed posttranslational modification sites are indicated. Model similar to previously published EMP family model35. b Predicted effects of first extracellular loop interactions with the membrane interface and consequence for apparent membrane thickness. The first extracellular loop was remodelled from initial homology model (based on claudin-19, PDB ID 3 × 29)34 and embedded in a representative cytoplasmic membrane composed of (mole percentages) 50% phosphatidylcholine/25% cholesterol/15% phosphatidylethanolamine/10% phosphatidylserine (inner leaflet only). All-atom explicit solvent molecular dynamics (MD) calculations (150 ns calculation time) were performed to refine initial homology model. Membrane thickness (phosphate-to-phosphate) is represented as a heat map with relative changes in bilayer dimensions colour-coded (green: average; red: increased; blue: reduced). The polypeptide is represented as a cyan ribbon; gold spheres indicate phosphate atoms of phospholipids. N.B. due to periodicity of the calculation space, the larger blue region at bottom of map lies beneath the large extracellular loop of EMP3 (at top of map extending over the edge). c Tentative model after MD calculations. EMP3 is represented as cyan ribbon cartoon and phospholipids as stick representations. Tryptophan residues in the first extracellular loop are shown (stick representation) to illustrate the high density of tryptophan residues within this loop (frequency of 0.15) as well as assumed intra-molecular disulphide bond (yellow). d as c but with phosphate atoms represented by gold spheres. e Phosphatidylserine molecules stably associated with the transmembrane segment are indicated by stick representation. These were observed to be coordinated by Arg160 (indicated by stick representation) located at the membrane interface near the C-terminus of the protein and remained associated with Arg160 for the majority of the trajectory. f Distribution of cholesterol molecules after MD calculations (stick representation), illustrating the relative accumulation of cholesterol beneath first extracellular loop (blue region in panel B/reduced membrane thickness). View from top of the membrane block. g Close-up of cholesterol accumulation beneath first extracellular loop as shown in (f), viewed from side.

