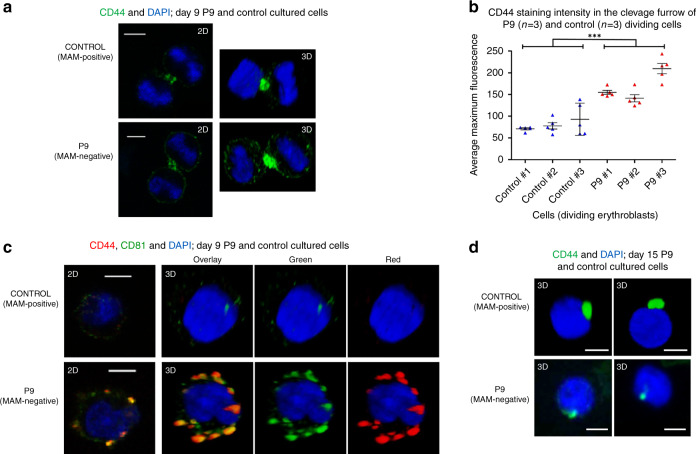
Fig. 6. Confocal microscope analysis of MAM-negative P9, MAM-positive control erythroblasts and enucleating erythroblasts cultured as described in Supplementary Fig. 6.
Control MAM-positive and P9 MAM-negative erythroblasts were harvested on day 9 and 15, fixed in 1% (wt/vol) paraformaldehyde, permeabilised with 0.05% (wt/vol) saponin and stained for the presence of CD44 and tetraspanin CD81. Nuclei were stained with DAPI (blue). Representative cells shown from approximately 10 micrographs per sampling day. a Dividing erythroblasts were stained with anti-CD44 (green) and shown in 2D and 3D. Scale bars are 5 µm. b Average CD44 staining intensities (n = 5 independent measurements from each dividing cell) of three P9 and three control dividing cells were obtained with Leica LAS AF software. MAM-negative samples showed significantly larger maximum fluorescence in the cleavage furrows than the control samples (two-tailed t test; df = 28, P = 1.14 × 10⁻⁸). Data are presented as mean values, with error bars representing standard deviation. Source data are provided as a Source Data file. c Erythroblasts stained with anti-CD44 (red) and anti-CD81 (green). Shown in 2D and 3D. Scale bars are 5 µm. d Representative free nuclei stained with anti-CD44 (green) showing CD44 to be associated with free nuclei after enucleation in the final stages of erythrocyte maturation. Shown in 3D. Scale bars are 5 µm.

