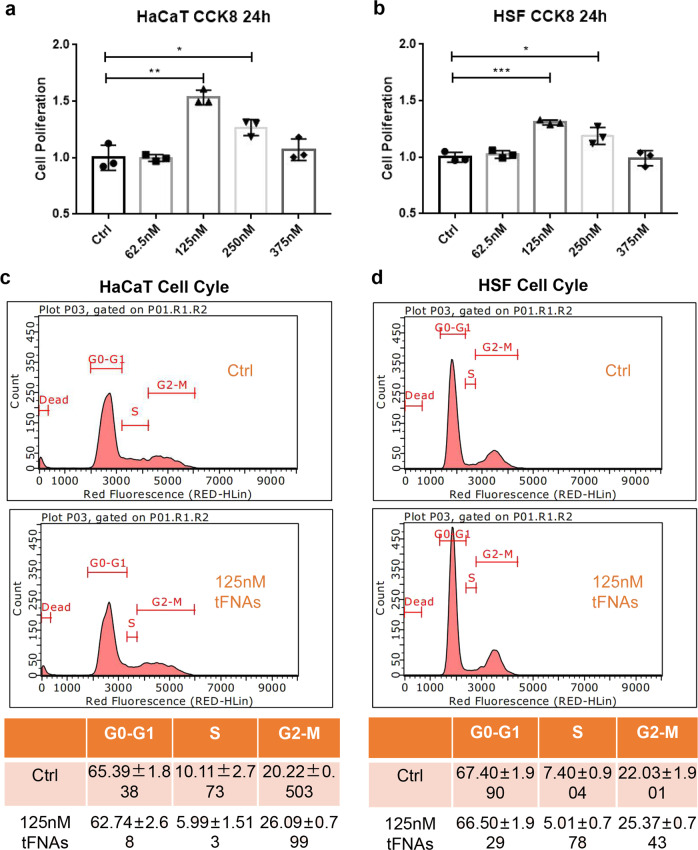
Fig. 2.
The effects of tFNAs on cell proliferation and cell-cycle regulation. a CCK-8 results of HaCaT cells after treatment with different concentrations of tFNAs for 24 h. Data are presented as the mean ± SD (n = 3). b CCK-8 results of HSF cells after treatment with different concentrations of tFNAs for 24 h. Data are presented as the mean ± SD (n = 3). c Flow-cytometry results of the cell cycle of HaCaT cells treated with or without 125 nM tFNAs for 24 h. Data are presented as the mean ± SD (n = 3). d Flow-cytometry results of the cell cycle of HSF cells treated with or without 125 nM tFNAs for 24 h. Data are presented as the mean ± SD (n = 3). Significance: *p < 0.05, **p < 0.001, ***p < 0.001

