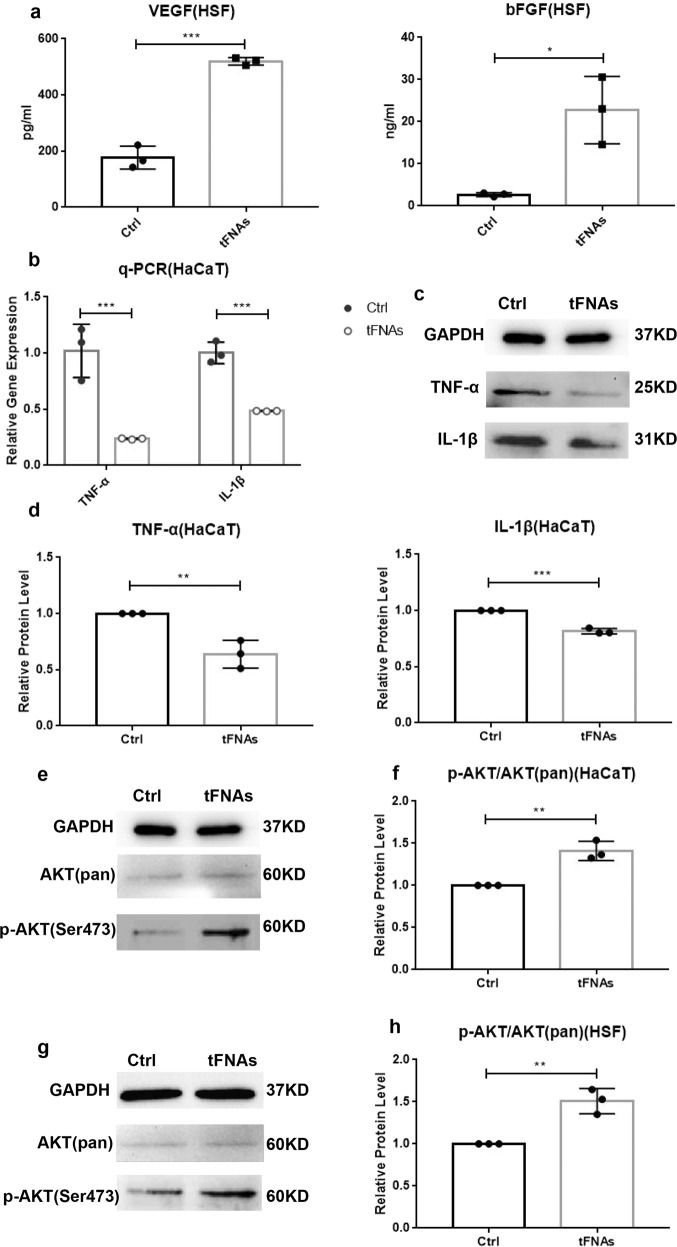
Fig. 4.
The effects of tFNAs on growth factors, inflammatory cytokines, and the AKT-signaling pathway. a ELISA results of VEGF and bFGF secretion after 24 h of treatment with 0 or 125 nM tFNAs. Data are presented as the mean ± SD (n = 3). b Relative gene expression levels of TNF-α and IL-1β after HaCaT cells were exposed to 0 or 125 nM tFNAs for 24 h. Data are presented as the mean ± SD (n = 3). c Detection of TNF-α and IL-1β protein expression by western blot analysis of HaCaT cells treated with or without 125 nM tFNAs for 24 h. d Semiquantitative analysis of TNF-α and IL-1β protein expression. Data are presented as the mean ± SD (n = 3). e Protein levels of AKT (pan) and p-AKT (Ser473) in HaCaT cells treated with or without tFNAs. f Quantification of the phosphorylation level of AKT in HaCaT cells. Data are presented as the mean ± SD (n = 3). g Protein expression of AKT (pan) and p-AKT (Ser473) in HSF cells treated with or without tFNAs. h Quantification of the phosphorylation level of AKT in HSF cells. Data are presented as the mean ± SD. Significance: *p < 0.05, **p < 0.01, ***p < 0.001

