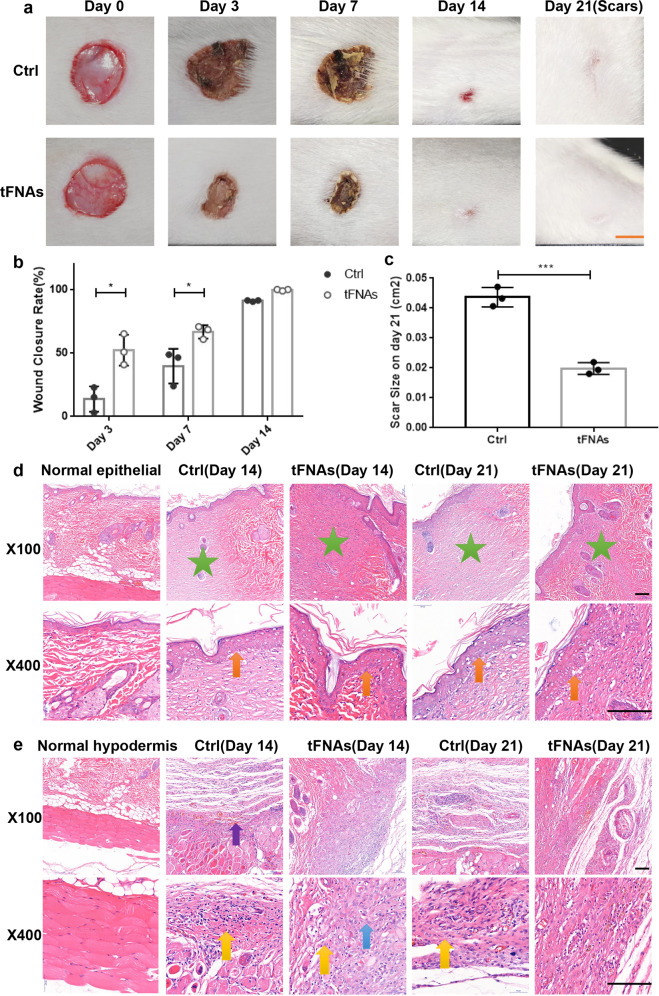
Fig. 5.
The effects of tFNAs on wound healing and scarring in rats. a Photographs of skin wounds on rats treated with saline or 125 nM tFNAs at different times (0, 3, 7, 14, and 21 days after surgery). Scale bars are 5 mm. b Comparison of the wound healing rate between the saline and tFNA groups. Data are presented as the mean ± SD (n = 3). c Size of scars measured on the 21st day postwounding. Data are presented as the mean ± SD (n = 3). d H&E staining of the epidermis (green star: scar area; orange arrow: epithelium thickening) Scale bars are 100 μm. e H&E staining of the hypodermis (yellow arrow: inflammatory cell infiltration; blue arrow: proliferation of fibroblasts; purple arrow: dermal hemorrhage) Scale bars are 100 μm. Significance: *p < 0.05, ***p < 0.001

