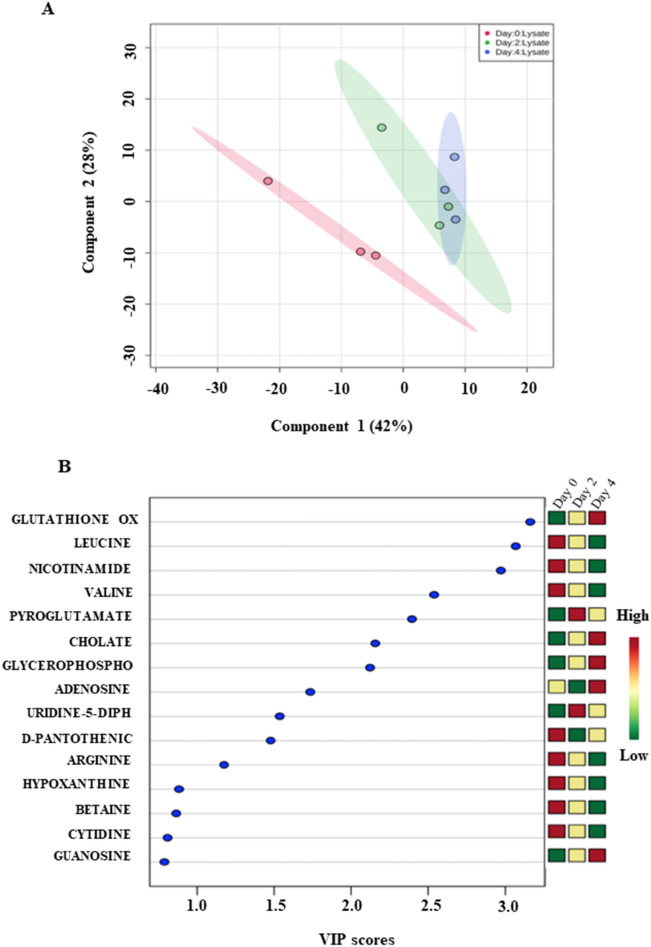
Figure 3.
(A) Partial least square discriminate analysis (PLS-DA) scores plot of proliferating (Day 0), early differentiating (Day 2) and late differentiating myogenic culture (Day 4). First component versus second component showing the separation of myogenic culture (Day 0) to early (Day 2) and late differentiating myogenic culture (Day 4). Component 1 and 2 explaining about 70% of the data. (B) VIP scores with the corresponding expression heat map. Green and red indicates the low and high metabolites levels respectively.

