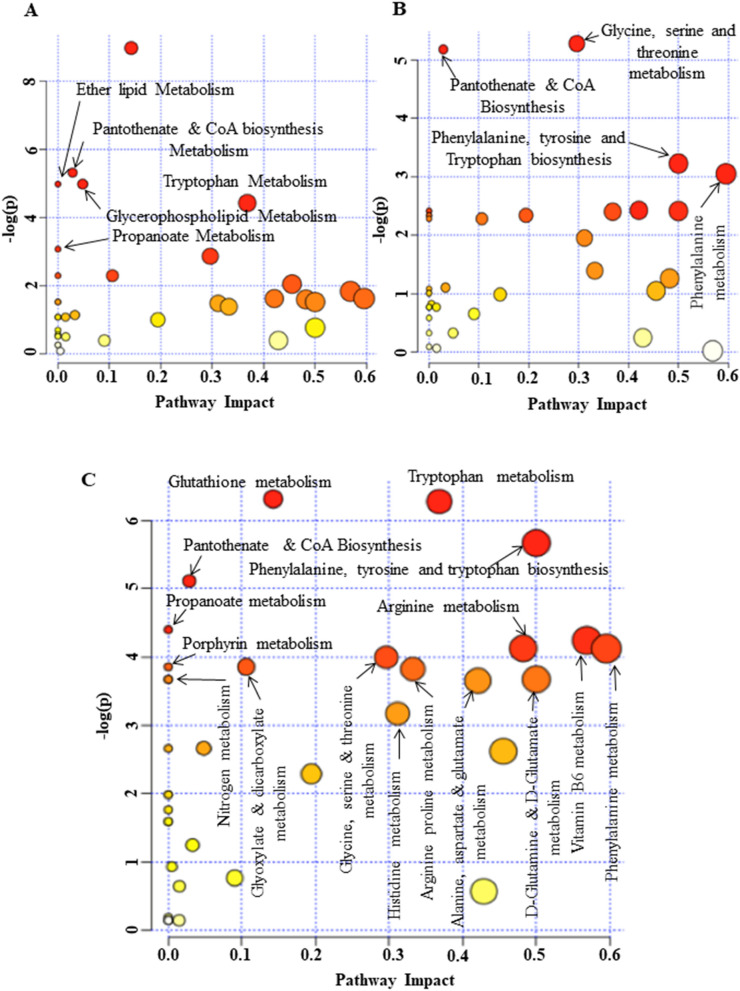
Figure 4.
Summary of pathway analysis with Ingenuity pathway analysis based on KEGG database. All the significantly match (p value < 0.05) were labeled. The color and size of each circle was based on p value and pathway impact value, respectively. Pathways that were significantly altered between (A) proliferating myoblasts (Day 0) and early differentiating culture (Day 2), (B) proliferating (Day 0) and late differentiating culture (Day 4), and (C) early and late differentiating cultures.

