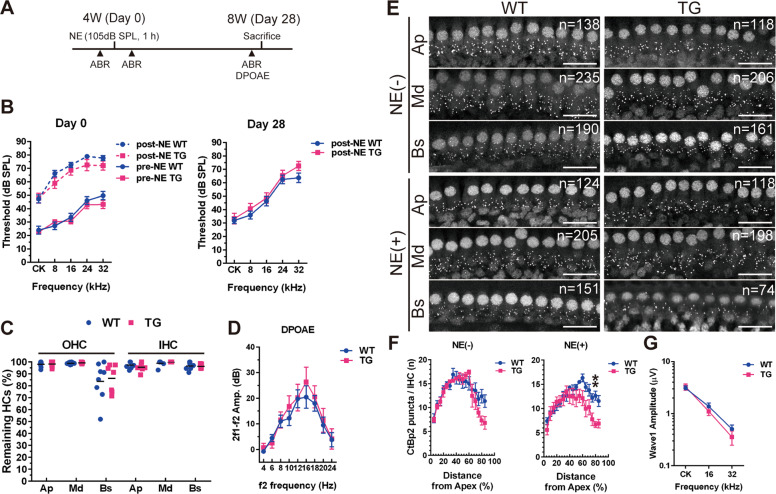
Fig. 2. Vulnerability of ribbon synapses to noise exposure in DIA1-TG mice.
a The protocol for the noise exposure (NE) experiments is illustrated. b Auditory brainstem response (ABR) thresholds (dB sound pressure level [SPL]) at click (CK), 8, 16, 24, and 32 kHz in WT and DIA1TG/TG (TG) mice were measured at the age of 4 weeks (4 W, just before and after NE at day 0) and 8 weeks (8 W, post-NE at day 28). Note the NE-induced a temporary threshold shift (TTS) both in WT and TG mice (n = 14). c The percentages of remaining inner hair cells (IHCs) and outer hair cells (OHCs) at each cochlear turn (Ap: apical, Md: middle, and Bs: basal turn) in WT and TG mice at day 28 after NE. There was no significant difference between WT (n = 8) and TG mice (n = 7). d Distortion product otoacoustic emission (DPOAE) measurement with pure-tone bursts at 4, 6, 8, 10, 12, 16, 18, 20, and 24 kHz at day 28 after NE. There was no significant difference between WT and TG mice (n = 8). e At day 28 after NE experiments (at 8-weeks-old), three turns of the cochlea (Ap, Md, and Bs) were obtained, and immunostained using a CtBP2 antibody. Each image shows confocal microscopic images obtained from the center of each cochlear turn, and the number of CtBP2-positive puncta in each image is indicated. In the absence of NE, there was no significant difference in the number of CtBP2-positive puncta in IHC at each cochlear turn, between WT and TG mice. NE-induced significant decreases in the number of puncta of IHCs at Bs in TG mice compared to WT mice. Scale bar: 20 μm. f The cochleogram shows the number of CtBP2-positive puncta per IHC in each percentage distance from the apex of the cochlea at 8 weeks, with or without NE. In the post-NE group, a significant decrease at the distance of 80% from apex was observed in TG mice compared with WT mice (n = 7). **p = 0.0036 by two-way ANOVA with Bonferroni post-hoc testing. g The wave I amplitudes with 90 dB SPL at CK, 16 and 32 kHz at day 28 after NE in WT (n = 20) and TG (n = 24) mice were graphed. There were no significant differences between WT and TG mice.

