Figure 3.
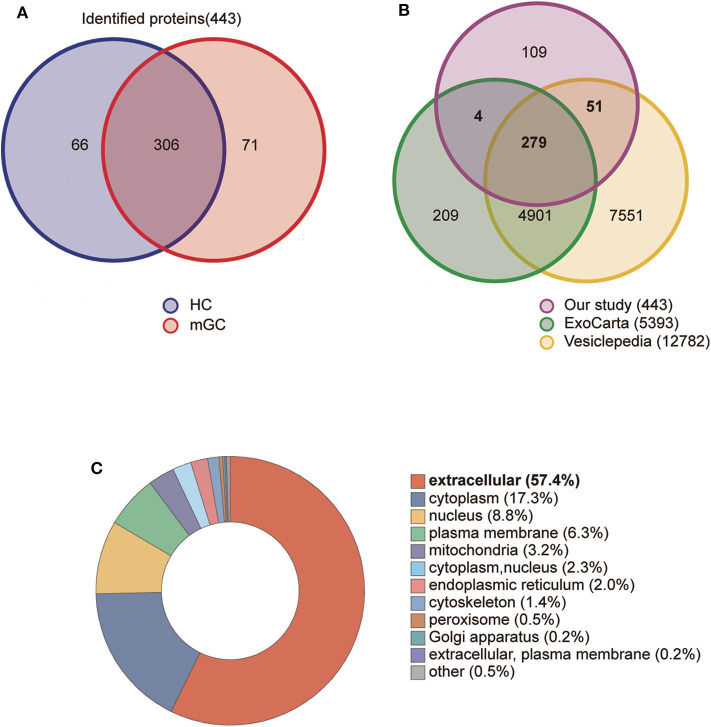
Proteomic analysis of serum derived exosomes. (A) The Venn diagram displays the distribution of exosomal proteins between mGC patients and healthy controls (HC). (B) The overlap of proteins identified in the present study with those in the Exocarta and Vesiclepedia databases (ExoCarta Version 5, Release date: 29 July 2015; Vesiclepedia Version 4.1, Release date: 15 August 2018). (C) The subcellular location of the total identified proteins predicted by wolfpsort on-line tool.

