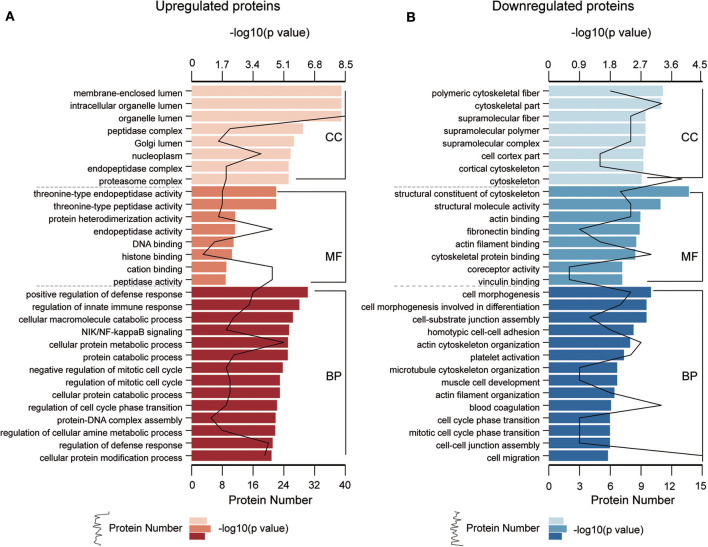
Figure 4.
GO enrichment analyses of differentially expressed proteins (DEPs). GO enrichment analysis of upregulated DEPs (A) and downregulated DEPs (B) in the cellular component (CC), molecular function (MF), and biological process (BP) categories. All significantly enriched GO terms (P < 0.05) involving DEPs are displayed. The specific proteins are listed in Table S4.

