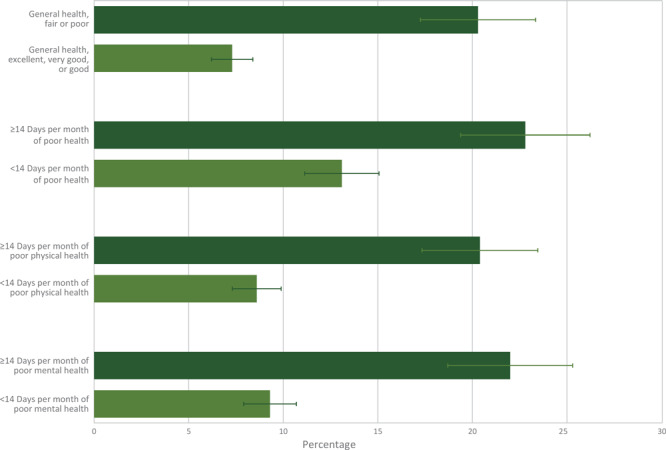
Figure 2.
Percentage and 95% confidence intervals of current pain related to cancer or cancer treatment by physical and mental health characteristics. Brackets indicate confidence intervals.
| Characteristic | Unweightedn | WeightedN | Percentage Reporting Current Pain (95% Confidence Interval) |
|---|---|---|---|
| General health fair or poor | 576 | 168,797 | 20.3 (17.7–23.2) |
| General health excellent, very good, or good | 566 | 154,608 | 7.3 (6.3–8.5) |
| <14 days per month of poor mental health | 876 | 232,927 | 9.3 (8.3–10.5) |
| ≥14 days per month of poor mental health | 253 | 87,729 | 22.0 (18.0–26.7) |
| <14 days per month of poor physical health | 709 | 197,768 | 8.6 (7.5–9.9) |
| ≥14 days per month of poor physical health | 411 | 119,416 | 20.4 (17.6–23.6) |
| <14 days per month of poor health | 563 | 162,144 | 13.1 (11.3–15.1) |
| ≥14 days per month of poor health | 283 | 89,903 | 22.8 (18.9–27.2) |