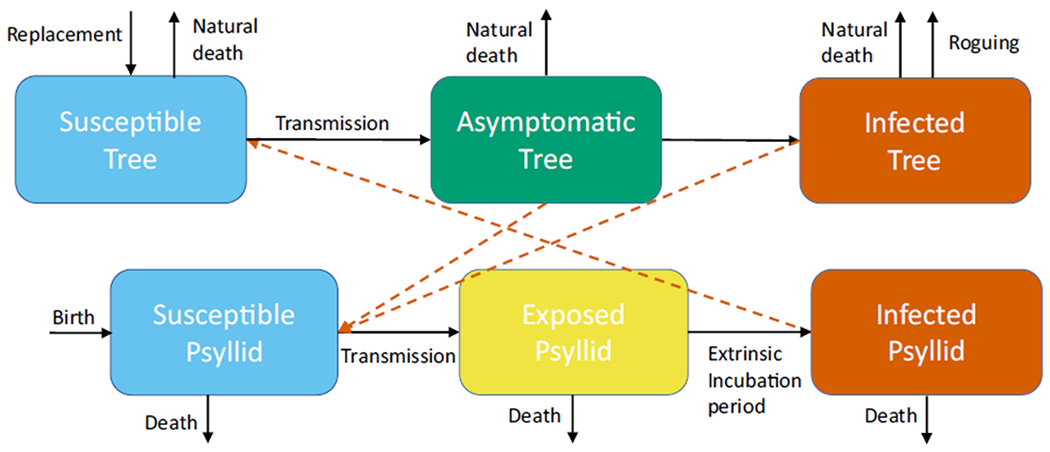
FIGURE 1.

A schematic of the model for HLB transmitted between trees and psyllids. Trees are susceptible, asymptomatic, or infected. Psyllids are susceptible, exposed or infected. Dead and rogued trees are replaced by susceptible trees. Black arrows show the transitions between the compartments. Orange dashed arrows show the necessary interactions between trees and psyllids to obtain transmission
