
FIGURE 3.
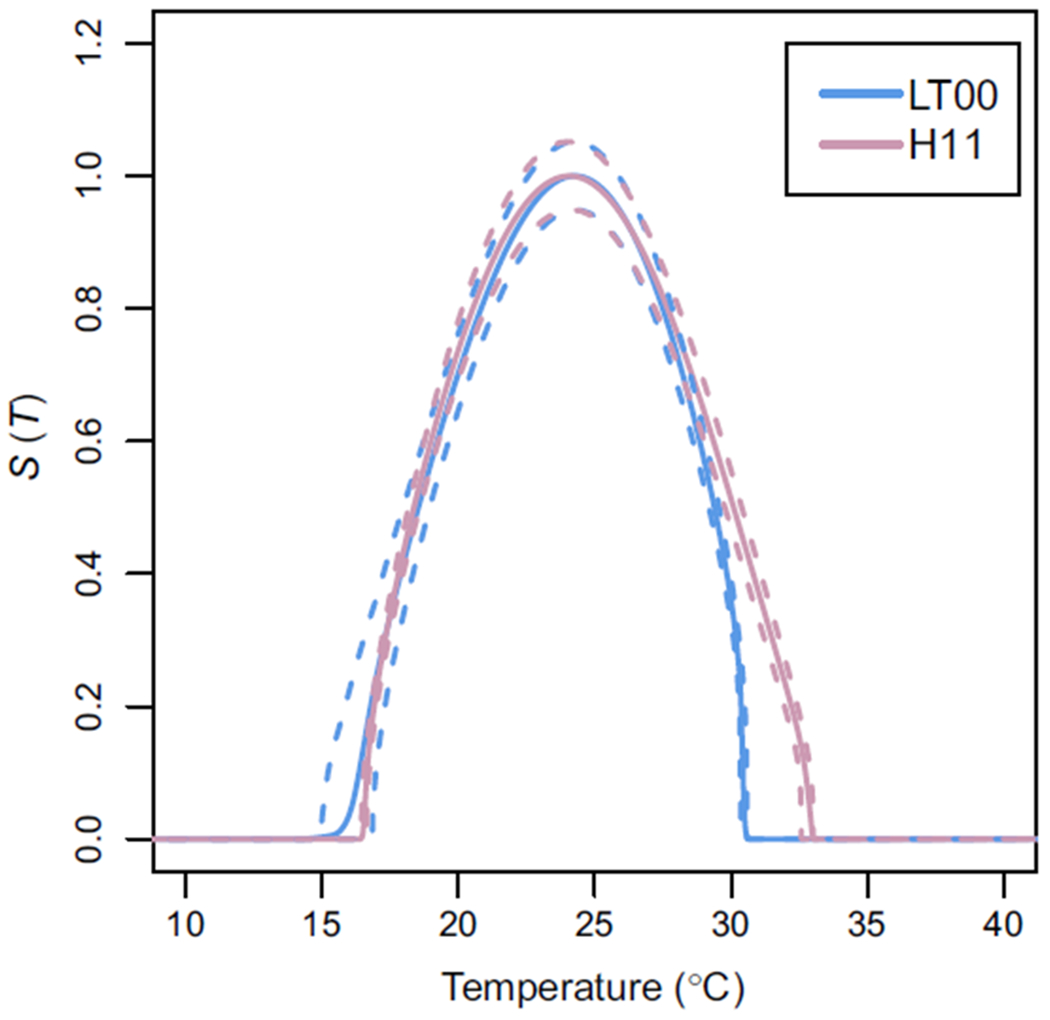
Posterior distribution of S(T) against temperature (°C) using data from Liu and Tsai (2000) (LT00, in blue) and Hall et al. (2011) (H11, in pink). Mean S(T) for both models is plotted using solid lines, 95% credible intervals are plotted with dashed lines. Both are independently scaled so that their maximum is 1