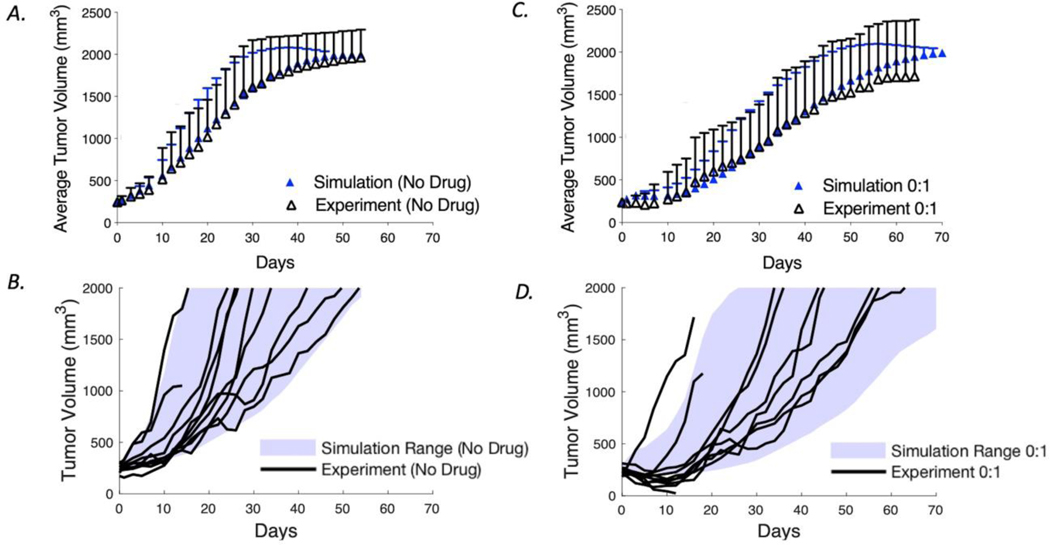
Fig. 3.
Model calibration of tumor growth rate and cell killing using average and variability of NCI-N87 xenograft tumors from Cilliers et al. (5). a The average experimental data and SD are plotted with the average and SD of simulated tumor sizes from 100 computational runs for the control group. b The range of growth rates for the simulations (shaded area) is shown together with individual tumor curves in the absence of drug treatment. c The average experimental data and SD are plotted with the average and SD of calibrated tumor sizes for a single dose. To calibrate cell killing in vivo, the growth curves for tumors treated with 3.6 mg/kg of T-DM1 were used to calibrate the probability of individual cell death as a function of intracellular payload concentration (Eq. 15). d The range of growth rates for the simulation (shaded area) is shown together with individual experiment curves for a treatment with a single dose

