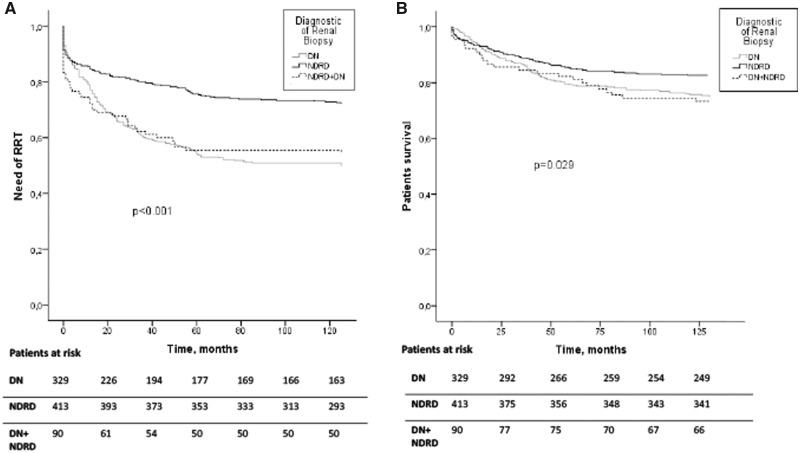
FIGURE 2.
Renal and patient survival curves in all groups studied. Analysis using Kaplan–Meier of the different groups divided according to renal diagnoses: NDRD, DN and mixed forms (DN plus NDRD). (A) Renal replacement therapy (RRT). (B) Mortality. The need of RRT (log-rank test P < 0.001) and mortality (log-rank test P = 0.029) were significantly increased in biopsy-proven DN patients.

