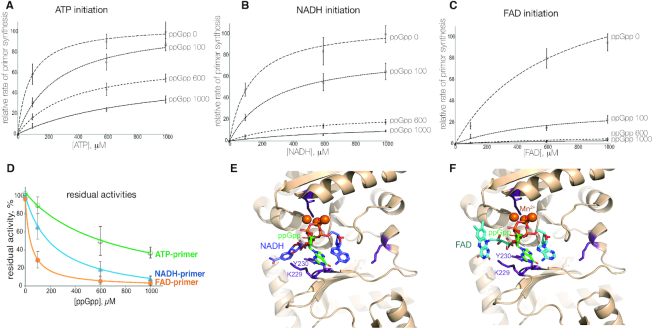
Figure 4.
Initiation with cofactors is more susceptible to inhibition by ppGpp than initiation with ATP. (A–C) Primer synthesis was measured at increasing concentration of initiation substrate – ATP, NADH and FAD. For each of the initiation substrates (designated on top as ATP initiation, NADH initiation and FAD initiation) an experiment was performed either without ppGpp (curve 0 ppGpp) or with increasing concentration of ppGpp – 100, 600 and 1000 μM. (D) Residual DnaG activities at 1000 μM initiation substrate are plotted against an increasing concentrations of ppGpp, in percentages from amounts in the absence of ppGpp. Error bars reflect standard deviations obtained from three independent experiments. (E and F) Structural models of E. coli DnaG complex with NADH and ppGpp and FAD and ppGpp, respectively. ppGpp is in green, NADH is in blue, FAD is in teal, amino acid residues which we tested for efficiency of cofactor initiation are in magenta, orange spheres are catalytic Mn2+ ions.

