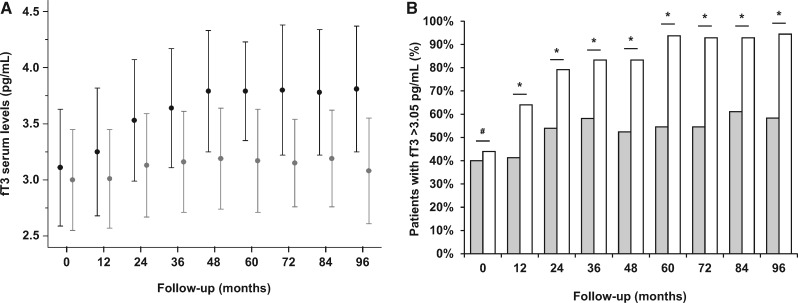
FIGURE 6:
Variations of fT3 serum levels during an 8-year follow-up in patients treated with diurnal and nocturnal HD. Serum levels of fT3 at baseline did not differ between HD and LNHD patients (P = 0.609). In the following 8 years, serum fT3 levels increased in the entire study group (ANOVA F = 5.700, P < 0.001). After stratification of the patients to two groups according to the HD schedule, a significant increase in mean fT3 serum levels was observed in both groups (ANOVA F = 3.315, P = 0.002 for LNHD; ANOVA F = 2.386, P = 0.016 for HD (A). At baseline, the percentage of patients with fT3 serum levels >3.05 pg/mL cut-off among different dialysis schedules did not differ between LNHD patients as compared with HD patients (44.0% versus 40.0% for LNHD and HD, respectively; P = 0.725). However, during an 8-year follow-up this rate significantly increased in LNHD patients as compared with HD patients (64.0% versus 41.3% at 1st year, P = 0.049; 79.2% versus 54.0% at 2nd year, P = 0.031; 83.3% versus 58.1% at 3rd year, P = 0.035; 83.3% versus 52.4% at 4th year, P = 0.024; 93.8% versus 54.5% at 5th year, P = 0.006; 92.9% versus 58.3% at 6th year, P = 0.024; 92.9% versus 61.1% at 7th year, P = 0.040; 94.4% versus 58.3% at 8th year, P = 0.015 for LNHD and HD, respectively) (B). X2-test for comparison of frequencies. #P = NS; *P < 0.05. Data in the graphs are expressed as mean ± SD (A) or percentage (B). LNHD patients: black dot with confidence interval (A) and white columns (B); HD patients: grey dot with confidence interval (A) and grey columns (B).

