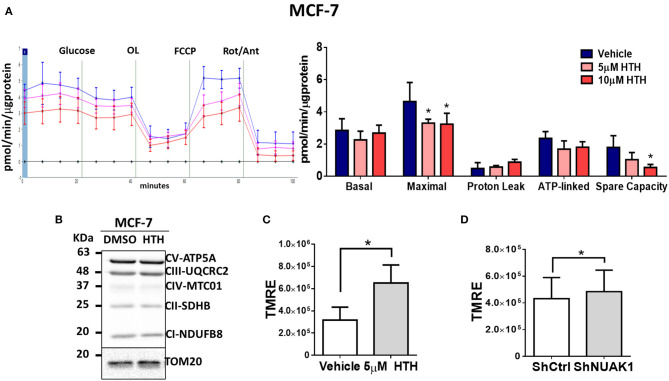
Figure 2.
NUAK1 allows proper mitochondrial function in breast cancer cells. (A,Left) Oxygen consumption rates of MCF-7 cells after 4 h incubation with 5 μM (pink curve) or 10 μM (red curve) HTH-01-015, or DMSO used as vehicle (blue curve), measured using the Seahorse XF24. At the times indicated, glucose, oligomycin (OL), FCCP, and Rotenone (Rot) with Antimycin A (Ant) were injected as described in the Methods section. (Right) Respiration parameters from the experiments on the left. Graph shows respiration parameters from MCF-7 cells with 5 μM (pink bar) or 10 μM (red bar) HTH-01-015, or DMSO (blue bar). All values were normalized to the corresponding protein concentration. OCR average ± SD from three independent experiments, *P < 0.05. (B) Western blot showing OXPHOS complex proteins from MCF-7 cells after 4 h incubation with 5 μM HTH-01-015 or DMSO. TOM20 was used as the loading control. (C) Quantification of TMRE mean intensity from in vivo microscopy of MCF-7 cells treated for 4 h with 5 μM HTH-01-015 or vehicle (n = 80), *P < 0.05. (D) Quantification of TMRE mean intensity from in vivo microscopy of NUAK1-silenced MCF-7 cells and control group (n = 80), *p < 0.05.

