Figure 3.
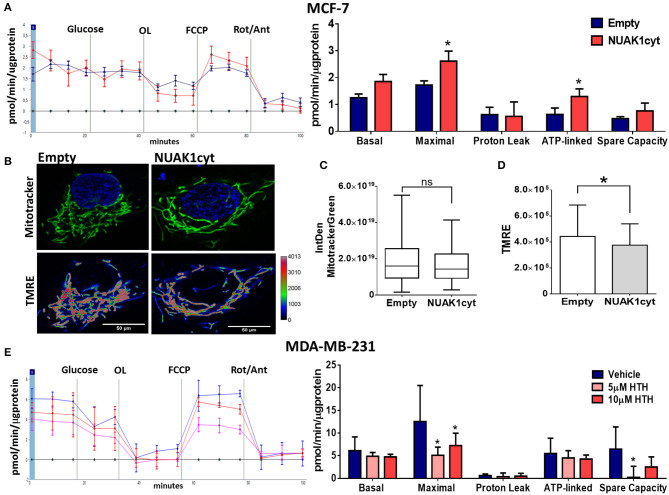
Cytosolic NUAK1 expression is involved in mitochondrial function regulation in breast cancer cells. (A, Left) Oxygen consumption rates of MCF-7 cells 24 h post-transfection with FLAG-NUAK1cyt mutant (red curve) or empty vector (blue curve), measured using the Seahorse XF24. At the times indicated, glucose, oligomycin (OL), FCCP, and Rotenone (Rot) with Antimycin A (Ant) were injected as described in the Methods section. (Right) Respiration parameters from the experiments on the left. Graph shows respiration parameters from MCF-7 cells transfected with FLAG-NUAK1cyt mutant (red bar) or empty vector (blue bar). All values were normalized to the corresponding protein concentration. OCR average ± SD from 3 independent experiments, *p < 0.05. (B) in vivo microscopy images of MCF-7 cells expressing FLAG-NUAK1cyt mutant or empty vector stained with mitotracker green (green), TMRE and Hoechst for nuclei (blue). Fluorescence intensity of TMRE is represented in pseudo color scale (“Rainbow RGB” in ImageJ software). 600X optical zoom plus 3X digital zoom. (C) Quantification of mitotracker green integrated density (n = 90). *p < 0.05. (D) Plots of TMRE mean intensity quantification (n = 90). *p < 0.05. (E) Same as in (A) for MDA-MB-231 cells. (Left) Oxygen consumption rates of MDA-MB-231 cells with 5 μM (pink curve) or 10 μM (red curve) HTH-01-015, or DMSO (blue curve). (Right) Respiration parameters from the experiments on the left. Graph shows respiration parameters from MDA-MB-231 cells with 5 μM (pink bar) or 10 μM (red bar) HTH-01-015, or DMSO (blue bar). All values were normalized to the corresponding protein concentration. OCR average ± SD from three independent experiments, *p < 0.05.

