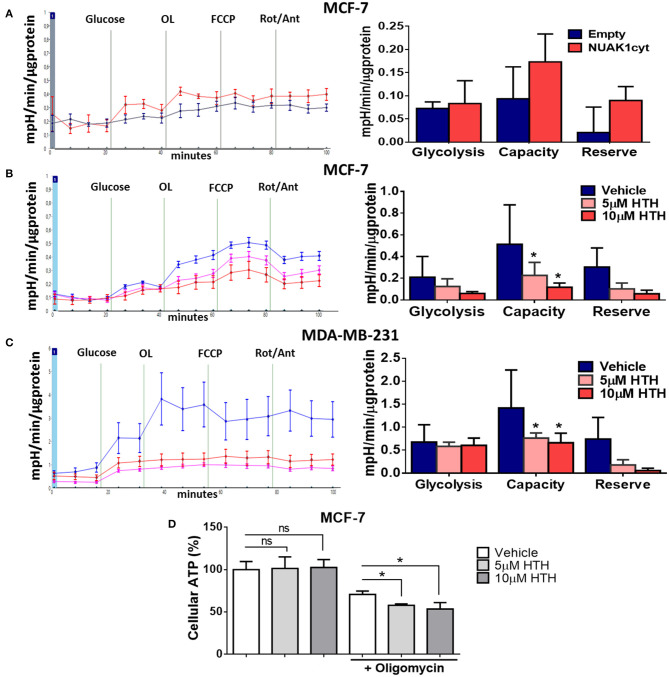
Figure 5.
Cytosolic NUAK1 plays a role in the regulation of glycolysis in breast cancer cells. (A, Left) Kinetic of extracellular acidification from MCF-7 cells 24 h post-transfection with FLAG-NUAK1cyt mutant (red curve) or empty vector (blue curve), measured using the Seahorse XF24. At the times indicated, glucose, oligomycin (OL), FCCP, and Rotenone (Rot) with Antimycin A (Ant) were injected as described in the Methods section. (Right) Glycolytic parameters evaluation from the experiments on the left. Graph shows MCF-7 cells with FLAG-NUAK1cyt mutant (red bar) or empty vector (blue bar). (B) Same as in (A, Left). Kinetic of extracellular acidification from MCF-7 cells after 4 h of treatment with 5 μM HTH-01-015 (pink curve), 10 μM HTH-01-015 (red curve) or vehicle (blue curve). Right. Glycolytic parameters evaluation from the experiments on the left. Graph shows cells with 5 μM HTH-01-015 (pink bar), 10 μM HTH-01-015 (red bar) or vehicle (blue bar). (C) Same as in (B) for MDA-MD-231 cells. (Left) Kinetic of extracellular acidification from cells with 5 μM HTH-01-015 (pink curve), 10 μM HTH-01-015 (red curve) or vehicle (blue curve). (Right) Glycolytic parameters evaluation from the experiments on the left. Graph shows cells with 5 μM HTH-01-015 (pink bar), 10 μM HTH-01-015 (red bar) or vehicle (blue bar). All values were normalized to the corresponding protein concentration. (A–C) ECAR average ± SD from three independent experiments, *p < 0.05. (D) ATP levels from MCF-7 cells treated 4 h with 5 μM HTH-01-015 (pink bar), 10 μM HTH-01-015 (red bar) or vehicle (blue bar). Also, all groups were incubated with 1 ug/ml oligomycin A. Results were expressed as a percentage relative to the control group. The results are representative of two independent experiments (n = 3). Each bar represents the mean ± S.D, *p < 0.05.

