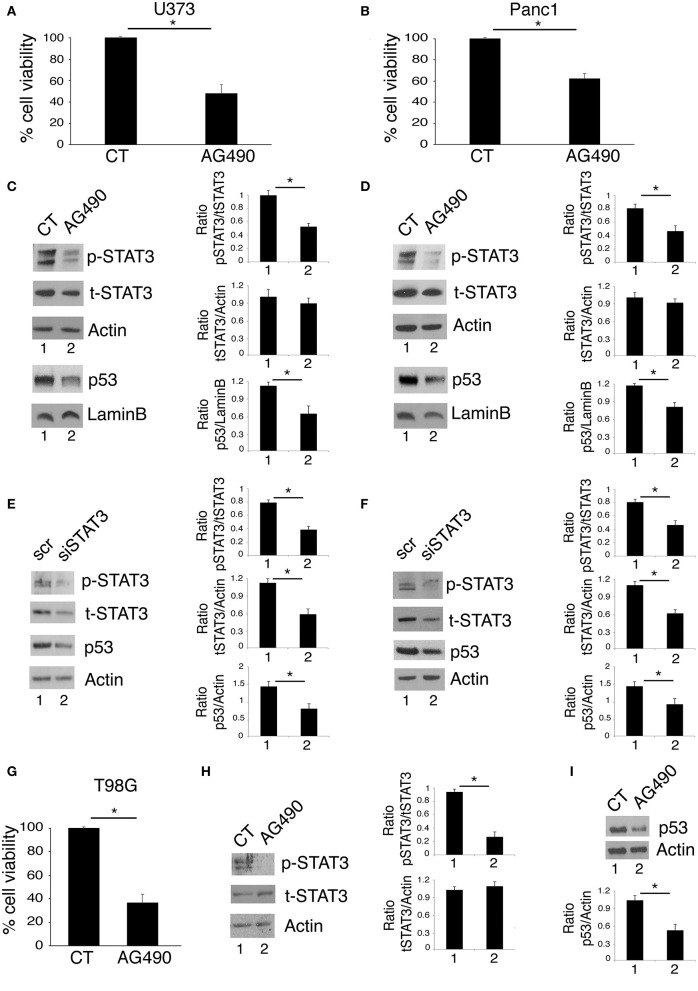
Figure 1.
STAT3 inhibition reduces cell survival and mutp53 expression in U373 and Panc1 cell lines. U373, Panc1, and T98G cell lines were cultured in the absence or in the presence of 100 μM AG490 for 48 h, and cell survival and mutp53 expression together with p-STAT3 and t-STAT3 expression were studied by trypan blue exclusion assay (A,B,G) and by western blot (C,D,H,I), respectively. The histograms (A,B,G) represent the mean plus S.D. of more than 3 experiments *P < 0.05; in western blot (C,D) Lamin B and (H,I) β Actin were used as loading control. In (E,F) mutp53 expression was evaluated by western blot in STAT3-silenced U373 (E) and Panc1 (F) for 48 h. β Actin was used as loading control. One representative experiment out of 3 is shown. The histograms represent the mean plus S.D. of the densitometric analysis of the ratio of specific band and control of 3 different experiments. *P < 0.05.

