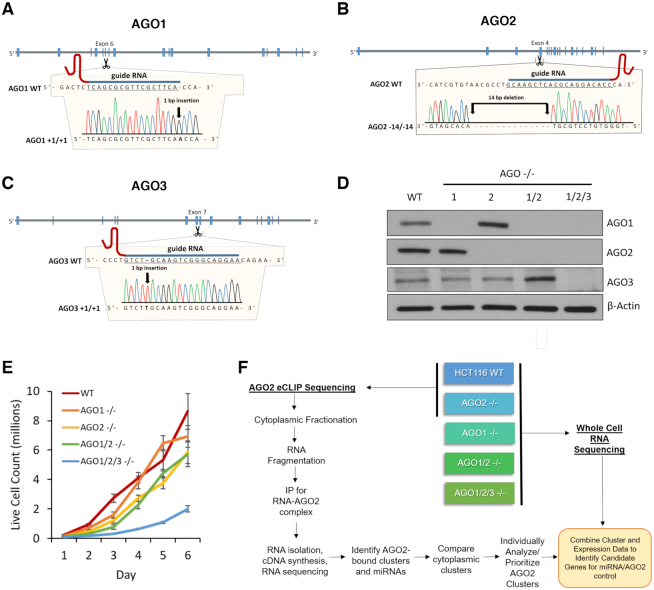
Figure 1.
Characterization of CRISPR-derived knockout cell lines. (A–C) Location of guide RNAs and mutations knocking out AGO1, AGO2 and AGO3 expression. (D) Western blot validating the AGO1, AGO2, AGO1/2 and AGO1/2/3 knockout cell lines (n = 3). (E) Effect of knockouts on growth rates. WT, AGO1, AGO2, AGO1/2 and AGO1/2/3 knockout cell lines were seeded at the same density, harvested, and analyzed for live cell count (n = 3). A Two-Way ANOVA with Bonferroni post-test analysis show that the AGO2−/− (P value 0.0066), AGO1/2−/− (P value 0.0045), and AGO1/2/3−/− (P value 0.0002) growth rates are significantly different from WT. (F) Scheme showing knockout of AGO variants, RNAseq analysis of gene expression changes relative to wild-type cells; and eCLIP-sequencing with anti-AGO2 antibody to identify potential miRNA–AGO2 binding sites. See also Supplemental Figure S1.

