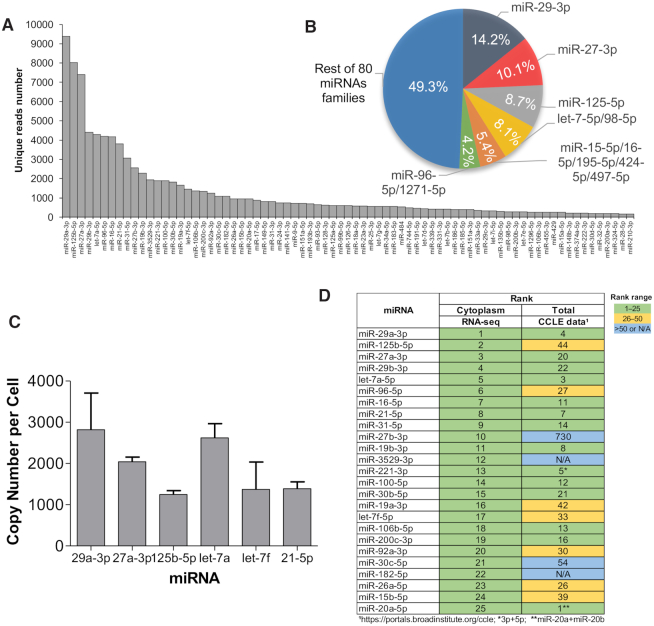
Figure 3.
miRNA expression in HCT116 cells. (A) miRNA abundance in cytoplasm, ranked by the read number associated with each miRNA after eCLIP. (B) Percentages of miRNAs belonging to the six most prevalent families. (C) Quantitative PCR (qPCR) determination of copy number of five well-expressed miRNAs. (D) Top 25 most prevalent miRNAs in cytoplasm detected by AGO2-eCLIP-seq compared to detection of those miRNAs identified by Nanostring sequencing of HCT116 cells in published CCLE encyclopedia (26). See also Supplemental Figure S3.

