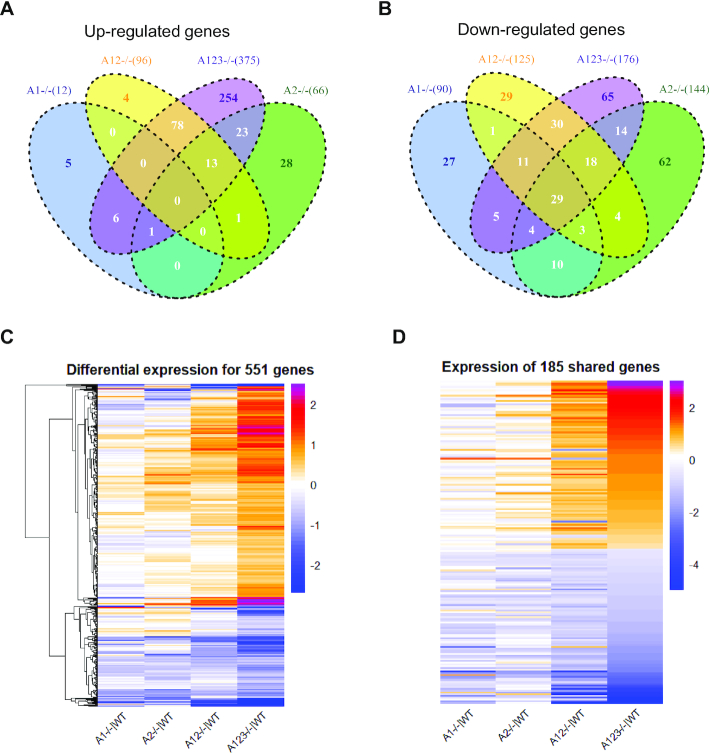
Figure 6.
Expression changes in AGO1, AGO2, AGO1/2 and AGO1/2/3 KO cells for genes with AGO2 protein binding clusters within their 3′-UTRs. (A, B) VENN diagram showing the the overlap among genes with AGO2:3′-UTR-binding sites and significant expression changes relative to wild-type cells for (A) increased or (B) decreased gene expression in wild-type versus knockout cells. (C) Heat map showing how the expression relative to wild-type cells changes in AGO1, AGO2, AGO1/2, and AGO1/2/3 cells for the 551 genes that have significant AGO protein:3′-UTR clusters and that are differentially expressed in AGO1/2/3 cells. (D) Heat map analysis showing relative changes in gene expression of the 179 AGO-associated genes that show significant expression changes in both AGO1/2 and AGO1/2/3 knockout cells.

