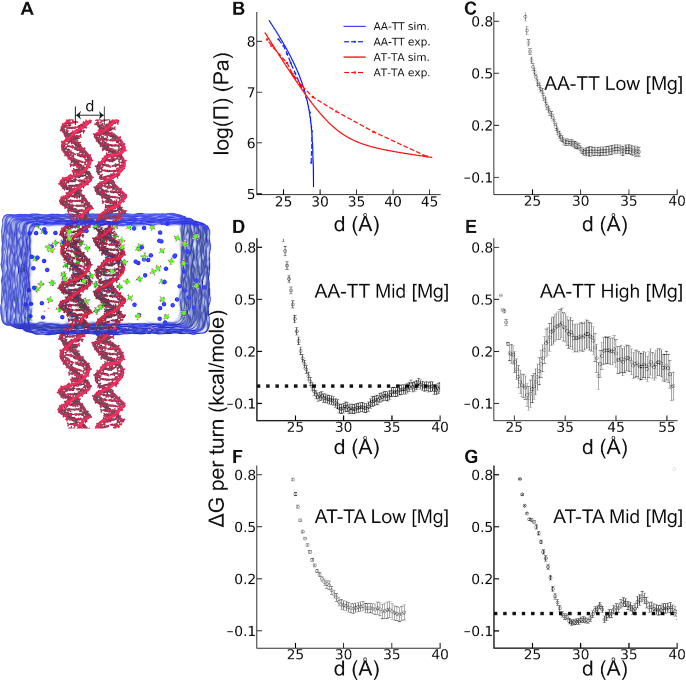
Figure 2.
Simulation results for the inter-DNA interactions of the two sequences: AA-TT (dA20-dT20) and AT-TA (d(AT)10-d(TA)10). (A) Simulation box with the two DNAs positioned parallel with an inter-helical distance of d. Green and blue spheres represent hexa-hydrated Mg2 +(H2O)6 and Cl− ions, respectively. Umbrella sampling simulations along the reaction coordinate d were used to compute the PMF between the two DNA helices. (B) Osmotic pressure as a function of inter-DNA spacing provides a direct comparison of the effective forces between DNA pairs with the OSM as denoted in legends (see ‘Materials and Methods’ section for details). Panels C–G show Gibbs free energy change as a function of the distance between DNA helices of the two sequences in different ionic conditions: (C) AA-TT at 22 mM [Mg2 +], (D) at 60 mM [Mg2 +] and (E) at 750 mM [Mg2 +]. (F) AT-TA at 22 mM [Mg2 +], and (G) AT-TA at 60 mM [Mg2 +]. The horizontal dashed lines are guide to eye. Statistical errors were estimated using bootstrap analysis with 100 number of bootstraps.

