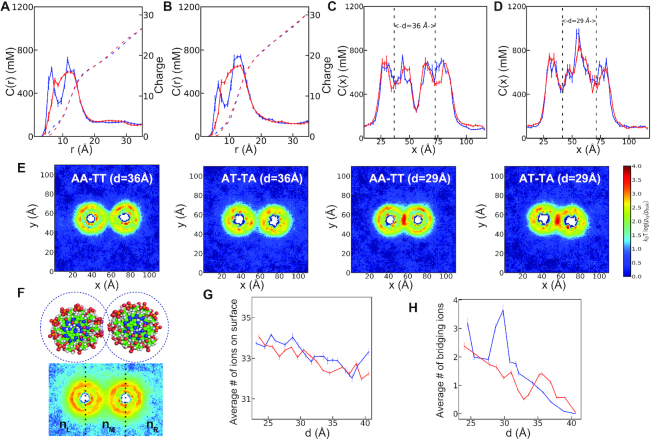
Figure 3.
Mg2 + ion distribution around the DNA duplexes of AA-TT and AT-TA in 60 mM bulk MgCl2 concentration. For panels A–D and G and H: The DNA duplex AA-TT is in blue color and AT-TA is in red color. (A) The Mg2 + ion distributions around the cylindrical axis of the DNA at d=36 Å (see Supplementary Data for details). (B) The same as in A, this time for d=29 Å. The Mg2 + ion density profiles are projected onto the Cartesian coordinate of x-axis. (C) The 1D concentration profile in inter helical distance of d=36 Å. (D) the same as C, this time for d=29 Å. The dotted lines are guide to eye showing the center of mass of each DNA. (E) The 2D concentration profile at inter helical distance d=36 Å and 29 Å. (F) Shown is the schematic description of the two binding modes. The number of the surface bound ions are computed by counting the Mg ions within 5 Å from the surface of the DNA surface (up) while the number of bridging ions, nB is defined as the difference between the number of ions at the middle part of the simulation box separated by the dashed lines and the two sides, nB=nM-(nL+ nR) where nM, nL and nR represent the ensemble average of the number of ions at the middle, left and right sides respectively (bottom). (G) Shows the total number of surface ions, and (H) the number of bridging ions, as a function of inter-helical separation.

