Figure 3.
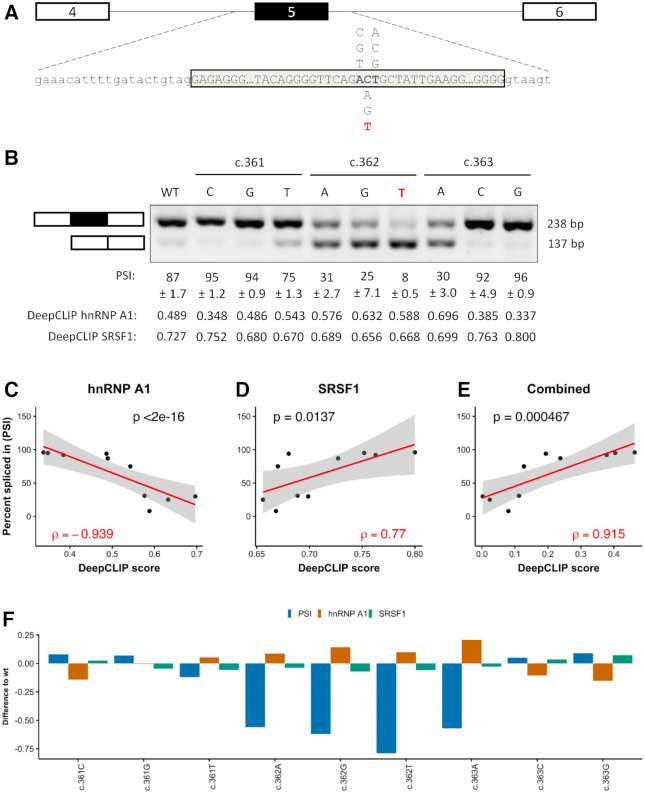
DeepCLIP models successfully model ACADM minigene splicing results. (A) Minigene schematic and location of variants tested, reference in blue. The disease-causing mutation is indicated in red. (B) Splicing of minigenes determined by RT-PCR. Estimates of mean PSI (n = 3) is indicated below, along with 95% CI size. (C) Scatter plot of PSI and DeepCLIP hnRNP A1 score with linear regression (red line, n = 10) and 95% confidence interval (shaded area). (D) Same as (C) but with DeepCLIP SRSF1 score instead. (E) Same as (C) and (D), but showing the DeepCLIP SRSF1 score minus the DeepCLIP hnRNP A1 score. (F) Barplot showing the difference to wt for the minigene PSI and DeepCLIP prediction scores for hnRNP A1 and SRSF1. Spearman's correlation coefficient is indicated in (C), (D) and (E).

