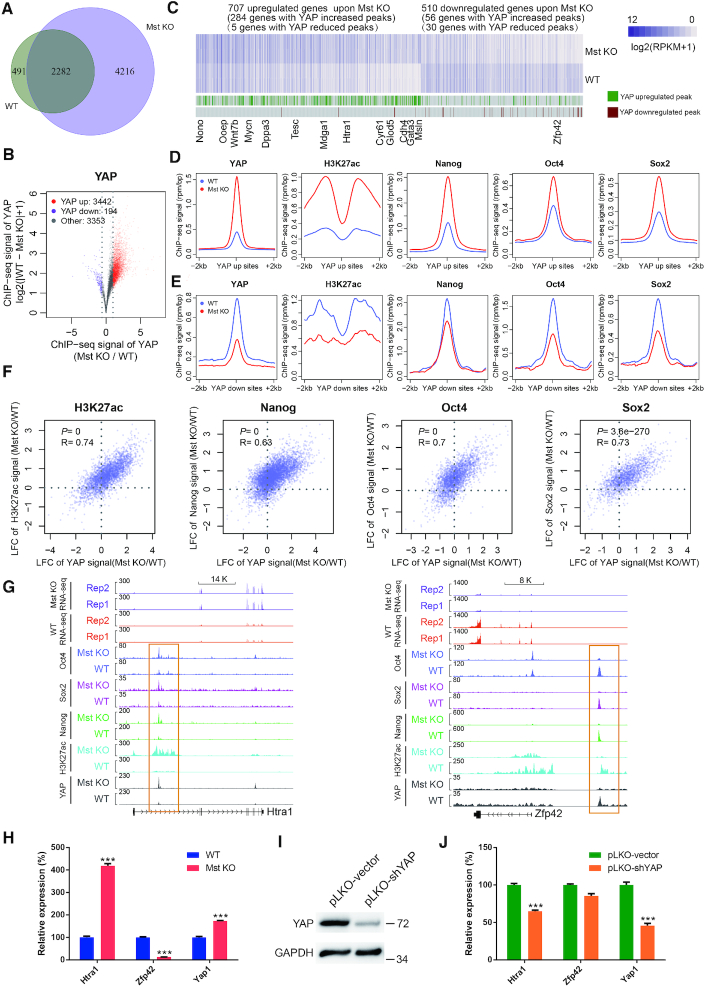
Figure 3.
YAP induces the binding of Nanog/Oct4/Sox2 and H3K27ac modification at YAP bound loci. (A) Venn diagram showing the overlap of YAP ChIP-seq peaks between WT and Mst KO ESCs. (B) Volcano plot showing the differences of YAP ChIP-seq signals between WT and Mst KO ESCs. The plot is based on the union YAP peaks of WT and Mst KO. (C) Heatmap of differentially expressed genes between WT and Mst KO ESCs. The genes with upregulated and downregulated YAP binding within 50kb of TSS are indicated below the heatmap. The names of representative genes were labelled at the bottom of the figure. (D and E) Metaplots of mean ChIP-seq signals of YAP, H3K27ac, Nanog, Oct4 and Sox2 in WT (blue line) and Mst KO (red line) ESCs across the centers and flanking regions of YAP peaks that are upregulated (D) or downregulated (E) upon Mst1/2 knockout. The plots are based on the union YAP peaks of WT and Mst KO. (F) Scatter plots demonstrating the correlations of ChIP-seq signal changes by Mst KO between YAP and H3K27ac, Nanog, Oct4 and Sox2 respectively. The plots are based on the union YAP peaks of WT and Mst KO. LFC: Log2 Fold Change. (G) Tracks showing gene expression and the co-localization of peaks of YAP, Nanog, Oct4 and Sox2 as well as H3K27ac modification at Htra1 and Zfp42 in WT and Mst KO ESCs. Orange rectangle indicates the bound enhancer region. (H) Real-time qPCR showing the expression level of Htra1, Zfp42 and Yap1 in WT and Mst KO ESCs. Error bars represent standard deviations (n = 3). Gapdh was used as an internal control. Statistically significant differences are indicated (*P< 0.05; **P< 0.01; ***P< 0.001). (I) Western blot showing protein level of YAP in YAP knockdown Mst KO ESCs. GAPDH was used as a loading control. (J) Real-time qPCR showing the expression level of Htra1, Zfp42 and Yap1 in control and YAP knockdown Mst KO ESCs. Error bars represent standard deviations (n = 3). Gapdh was used as an internal control. Statistically significant differences are indicated (*P< 0.05; **P< 0.01; ***P< 0.001).

