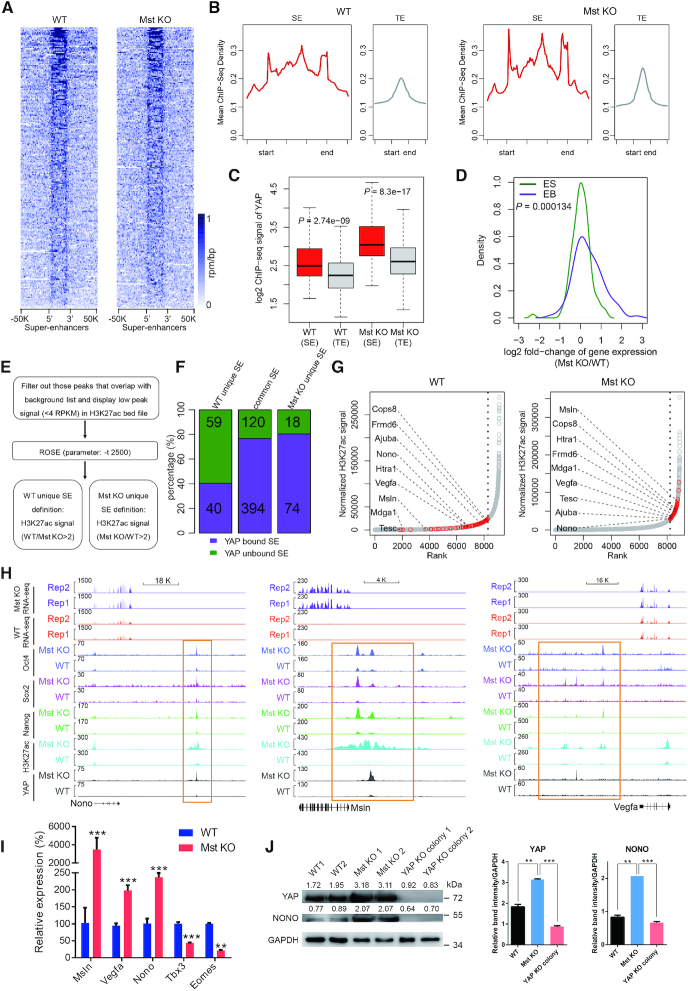
Figure 4.
YAP directs the formation of new super-enhancers in Mst KO ESCs. (A) The heatmaps of YAP signals at 231 annotated mouse ESC specific SE loci in WT and Mst KO ESCs. (B) Metaplots of average YAP ChIP-seq signals at SE and TE loci in WT and Mst KO ESCs. (C) Box plot showing YAP signals at SEs and TEs in WT and Mst KO ESCs respectively. (D) Density plot comparing the expression change of SE-associated YAP bound genes upon Mst knockout at ES stage (green) and EB stage (purple). (E) Illustration of the computational pipeline to identify SEs in WT and Mst KO ESCs using H3K27ac ChIP-seq data. (F) Bar-plot showing percentage of YAP bound SEs (purple) and unbound SEs (dark green) that were unique or common in WT and Mst KO ESCs. The exact numbers of YAP bound or unbound SEs are marked within respective colored areas. (G) The dot plots showing the distributions of enhancers and SEs sorted and ranked by H3K27ac ChIP-seq signals using ROSE program in WT and Mst KO ESCs respectively. An obvious geometric inflection point was revealed by a dash line. Dots on the left of the dash line represents TEs, while dots on the right of the dash line represents SEs. YAP target genes regulated by TEs in WT ESCs but shifted to be regulated by SEs in Mst KO ESCs are highlighted as red dots. Representative lineage differentiation-associated genes are labelled. (H) Track views of ChIP-seq profiles of indicated factors and RNA-seq expression profiles at Nono, Msln and Vegfa in WT and Mst KO ESCs. Newly formed SE upon Mst knockout are marked with orange rectangle. (I) Real-time qPCR showing the relative expression level of Msln, Vegfa, Nono, Tbx3 and Eomes in WT and Mst KO ESCs. Error bars represent standard deviations (n = 3). Gapdh was used as an internal control. Statistically significant differences are indicated (*P< 0.05; **P< 0.01; ***P< 0.001). (J) Western blot showing protein level of YAP and Nono in WT, Mst KO and Mst/YAP double KO ESCs. GAPDH was used as a loading control. The densitometric analyses of YAP and NONO protein levels relative to GAPDH in each sample were shown in western blot assay by ImageJ software.

