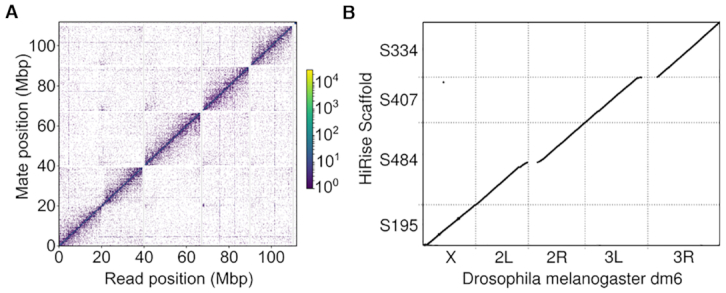
Figure 2.

Genome Contiguity. (A) The read density map for Hi-C read pairs mapped onto the five largest contigs in our final assembly. (B) Dot plot of Hi-C scaffold assembly mapped to the dm6 reference genome. Continuous diagonal lines represent full length scaffolds of all major chromosome arms. For clarity of visualization, we restricted this plot to alignments of 5 kb or more using delta-filter in the mummerplot package.
