Figure 2.
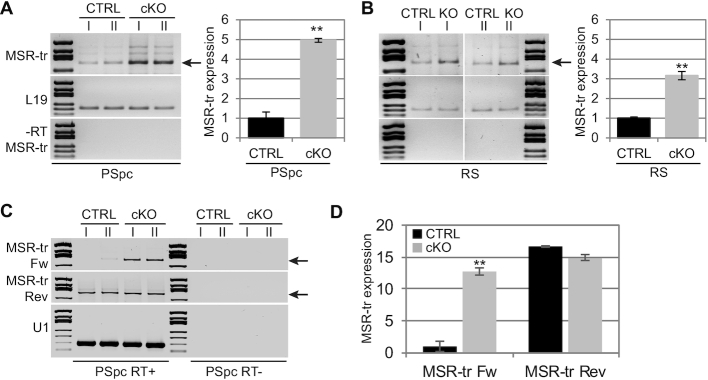
Major satellite repeat expression is misregulated in Dicer1 knockout germ cells. (A, B) Semi-quantitative RT-PCR for enriched populations of pachytene spermatocytes (PSpc) (A) and round spermatids (RS) (B) from control and Dicer1 cKO mice revealed increased levels of MSR transcripts in both cell types, particularly in spermatocytes, in the absence of DICER. MSR-tr 308 bp band (arrow in A) intensities were quantified using ImageJ and normalized to L19 band intensity in each sample. MSR-tr expression is shown relative to the CTRL samples that were set as ‘1’; n = 2, SEM, ** P< 0.01. (C) Strand-specific expression of MSR was analyzed in control and Dicer1 cKO spermatocytes. Only forward strand of MSR was found more highly expressed in Dicer1 knockout spermatocytes. (D) 308 bp MSR-tr signal (arrows in C) was quantified and normalized to U1 signal in each sample. MSR-tr Fw and Rev expression in cKO is shown relative to the CTRL Fw sample that was set as ‘1’; n = 2, SEM, ** P< 0.01. See also Supplementary Figure S1B–F.

