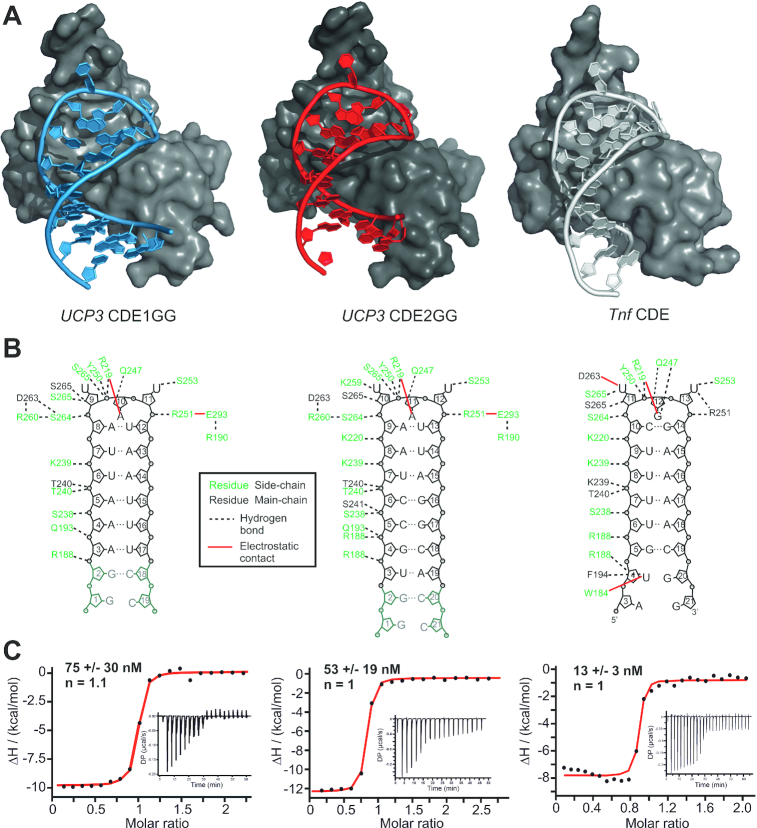
Figure 4.
Crystal structures of CDE1GG and CDE2GG in complex with the ROQ domain. (A) Overall structures of ROQ (grey surface) in complex with CDE1GG (blue cartoon) and CDE2GG (red cartoon). For comparison, the same view of ROQ in complex with the Tnf CDE is included (grey cartoon) (38). (B) Internal contact map of ROQ domain residues with UCP3 CDE1GG and CDE2GG in panel (A). For comparison, the same is shown for ROQ in complex with the Tnf CDE (38). (C) Representative ITC curves of ROQ titrated with the RNAs as shown in (B) reveal binding affinities comparable to the Tnf CDE. KD values are mean +/− standard deviation from three independent experiments. See also Supplementary Figure S5.

