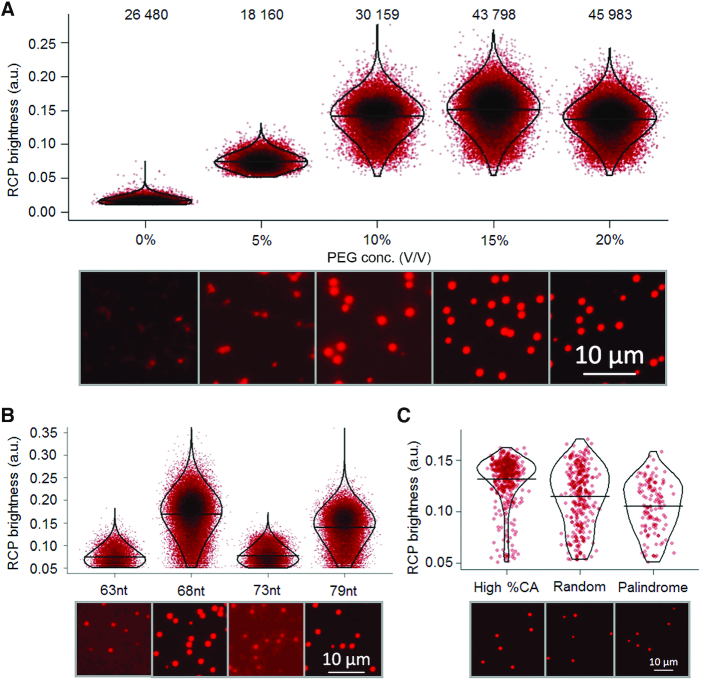
Figure 2.
Conditions for efficient RCA were investigated by recording numbers of detected signals and the brightness of individual RCP. Each dot in the graphs represents the brightness of an individual RCP (calculated as the ratio between the intensity and area). For each investigated condition the dots in the graphs were distributed along the x-axis according to a normal distribution. Dots that are overlapping are shown in increasingly dark color. The distributions are overlaid with violin plots and the median brightness is indicated with horizontal lines. The efficiencies were also investigated via visual interpretation of microscope images with increased brightness and contrast. (A) RCA efficiencies were evaluated with increasing concentrations of PEG 4000 added. The numbers of RCPs recorded in the three images analyzed for each sample are displayed at the top. (B) RCPs resulting from circular templates of four different sizes (63, 68, 73 or 79 nucleotides) were compared. Circular DNA templates of 68 and 79 nucleotides produced brighter RCPs compared to 63 and 73 nucleotide circles. (C) 68 nucleotide long circular templates of different sequence composition were analyzed with respect to RCP brightness. Circular templates with high cytidine and adenosine content generated brighter RCPs that were more even in intensity, compared to a library with random sequences and a sequence with self-complementary palindromic elements.

