Figure 5.
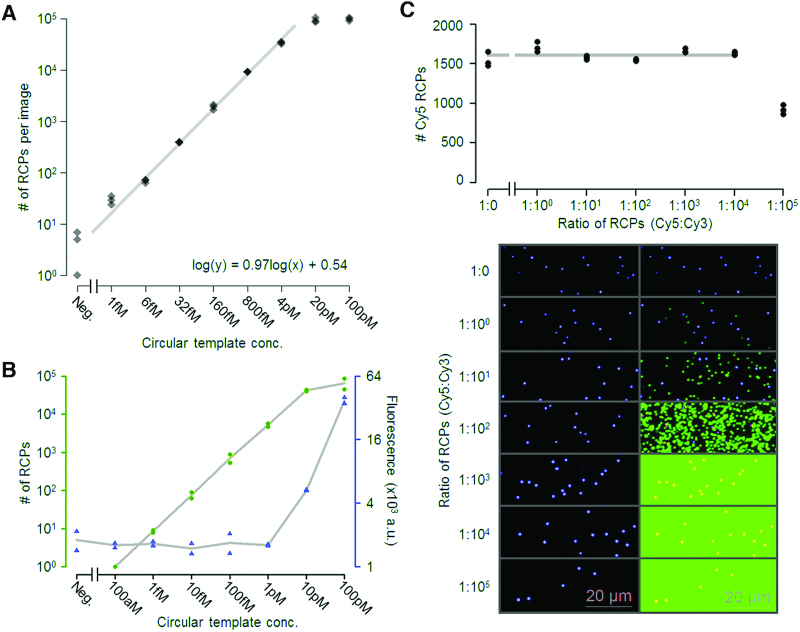
Evaluation of the linearity, dynamic range and saturation of amplification of circular templates on a solid support. (A) The dynamic range was evaluated using a five-fold dilution series from 100 pM to 1 fM along with a negative control (immobilization buffer without circular templates). Three images were acquired from each concentration and the recorded numbers of RCPs are displayed in a scatter plot. The grey line represents log-log linear regression calculated from the average numbers of RCPs per image from the five concentrations between 6 fM and 4 pM. The slope of the regression line, at 0.97, is very close to 1, corresponding to perfect absolute quantification. The dynamic range was demonstrated to be around 10 000-fold (1 fM to 10 pM) with excellent linearity. (B) The dynamic range of the present method with digital enumeration was compared to the analog measurement of total fluorescence per well using a plate reader, for streptavidin-coated μ-clear 96-well plates. Because of the lower background, several thousand-fold lower amount could be recorded by the digital measurement compared to the analog. (C) Detection of RCPs from a particular DNA circle was evaluated as a function of increasing numbers of total DNA circles. 100 fM of circles detected using Cy5-labeled detection probes (blue dots) were mixed at ratios between 1:0 and 1:100 000 with circles detected with Cy3-labeled probes (green dots). Counts of Cy5-labeled RCPs were calculated from six images captured from each ratio. These values were visualized in a scatterplot (top) with Cy5 counts on the y-axis and the added ratios of DNA circles templating RCA displayed on the x-axis. The grey line represents the average value of Cy5-labeled RCPs demonstrating closely similar detection efficiencies in all samples except that where a hundred thousand-fold excess of the DNA circle whose RCPs were detected in green.

