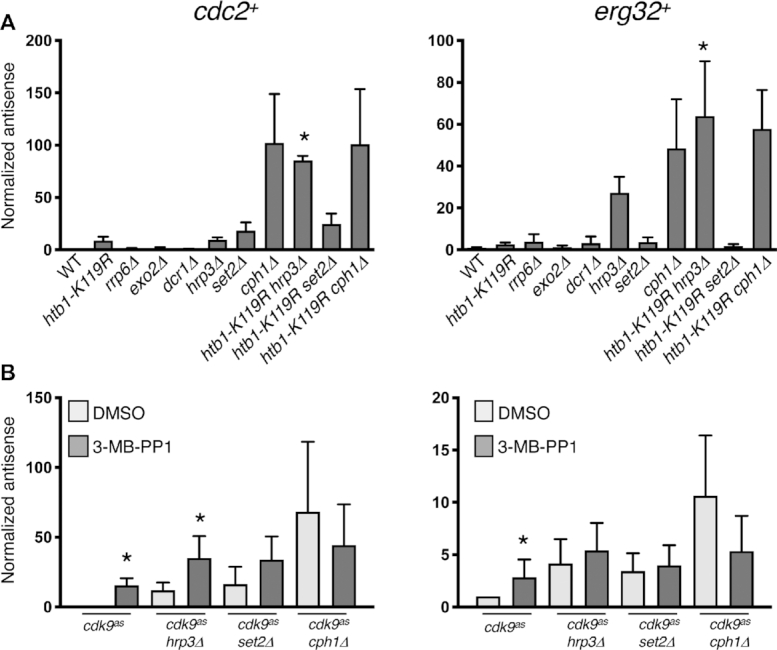
Figure 4.

Epistasis relationships implicate Set2 and the Clr6-CII HDAC complex downstream of Cdk9 and H2Bub1. (A) Antisense transcript levels at cdc2+ and erg32+ loci were quantified by strand-specific RT-qPCR in the indicated strains. Error bars denote S.D. from 3–4 independent experiments; ‘*’ denotes significant differences (P< 0.05; paired t-test) between the indicated double mutant strain and the respective single mutants. Value for the wild-type strain was set to 1. (B) As in (A) for the indicated cdk9as strains. ‘*’ denotes significant differences (P< 0.05; unpaired t-test) between 3-MB-PP1-treated cells and the corresponding DMSO-treated control. Value for the DMSO-treated cdk9as strain was set to 1.
