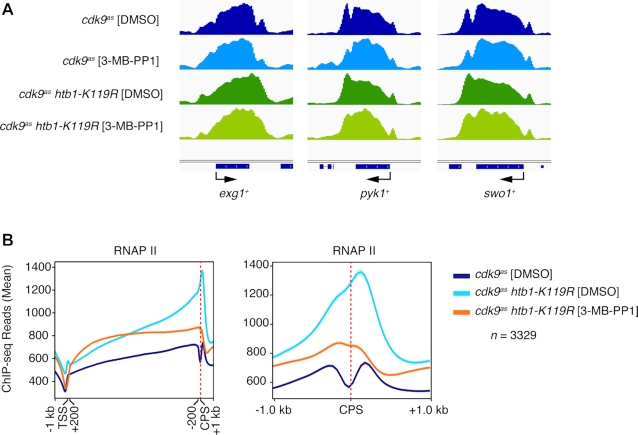
Figure 7.
Loss of H2Bub1 alters RNAPII distribution around the CPS. (A) Browser tracks show RNAPII distribution on representative genes in the indicated strains treated with 3-MB-PP1 or DMSO. (B) Metagene plots show RNAPII distribution across the entire gene, with scaling of regions between 200 bp downstream of TSS to 200 bp upstream of CPS (left); and around the CPS (±1 kb, unscaled; right), for 3329 genes.

