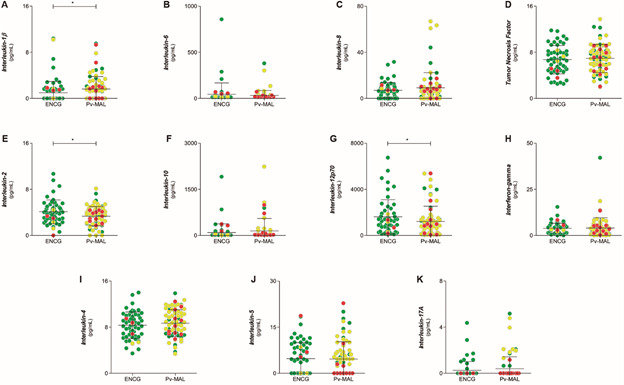
Fig. 4: comparison of serum concentrations of Th1/Th2/Th17 cytokines in endemic control group (ENCG) and Plasmodium vivax malaria (Pv-MAL). The Th1/Th2/Th17 cytokines was dotted between ENCG and Pv-MAL patients. They were separated in a production order and serum concentrations, picogram per milliliter (pg/mL): (A) IL-1β; (B) IL-6; (C) IL-8; (D) TNF; (E) IL-2; (F) IL-10; (G) IL-12p70; (H) IFN-γ; (I) IL-4; (J) IL-5 and (K) IL-17A. The individuals were grouped according in non-thrombocytopenic (green circle), mild (yellow circle) and severe thrombocytopenia (red circle).