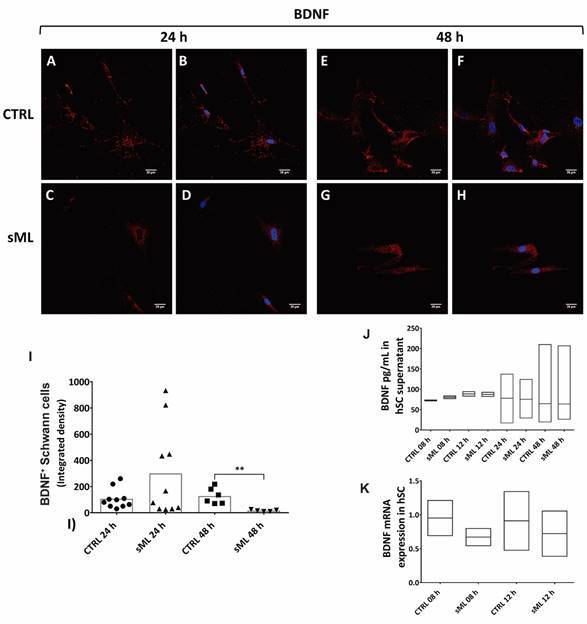
Fig. 3: BDNF in human Schwann cells (hSC). Confocal microscopy of BDNF immunodetection (red, AlexaFluor 594, Molecular Probes) and nuclear labeling by DAPI (blue, Molecular Probes) in hSC culture, treated or not with sonicated Mycobacterium leprae (sML, 10 µg/mL) for (A-D) 24 and (E-H) 48 h. Scale bar = 20 µm. (I) Graph illustrates the fluorescence intensity of BDNF in hSC, shown as scatter plots with means, from unpaired t-test with Welch’s correction. ** p < 0.01. (J) The secretion of BDNF is shown in the graph of hSC culture supernatants treated by sML for 08, 12 and 24 h. BDNF concentration (pg/mL) was retrieved from four independent assays. Kruskal-Wallis test with Dunn’s multiple comparisons test (p > 0.05), line at the median. (K) BDNF mRNA expression, normalised by GAPDH, is graphically demonstrated in unstimulated (CTRL) and sML-treated hSC, after 08 and 12 h. Reverse transcription-polymerase chain reaction (RT-PCR) results from two independent assays. Kruskal-Wallis test with Dunn’s multiple comparisons test (p > 0.05), line at the median.

