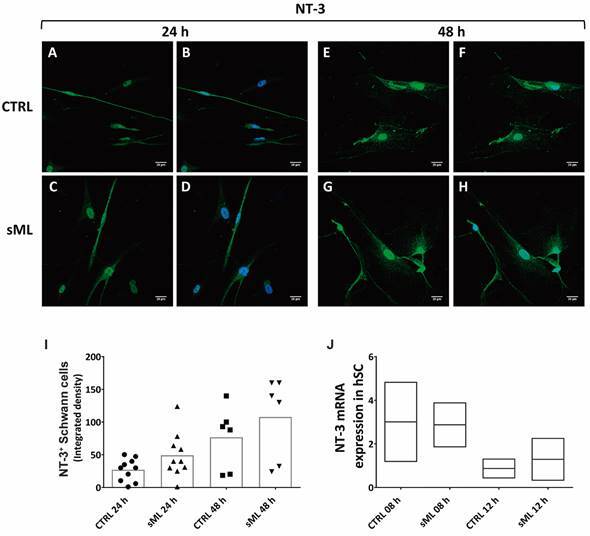
Fig. 5: NT-3 in human Schwann cells (hSC). Confocal microscopy of NT-3 immunodetection (green, AlexaFluor 488, Molecular Probes) and nuclear labeling by DAPI (blue, Molecular Probes) in hSC culture treated or not with sonicated Mycobacterium leprae (sML, 10 µg/mL) for (A-D) 24 and (E-H) 48 h. Scale bar = 20 µm. (I) Graph illustrates the fluorescence intensity of NT-3 in hSC, shown as scatter plots with means, from unpaired t-test with Welch’s correction. (J) NT-3 mRNA expression, normalised by GAPDH, is graphically demonstrated in unstimulated (CTRL) and sML-treated hSC, after 08 and 12 h. Reverse transcription-polymerase chain reaction (RT-PCR) results from two independent assays. Kruskal-Wallis test with Dunn’s multiple comparisons test (p > 0.05), line at the median.

