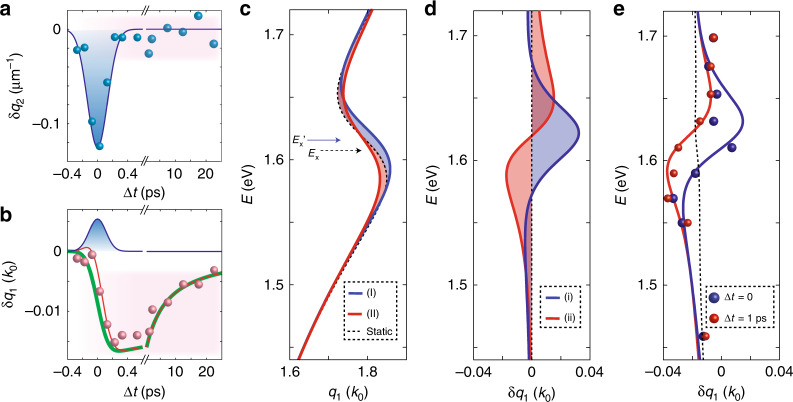
Fig. 3. Differential dispersion and dynamics of the waveguide mode in WSe2.
These data were collected on a 90 nm slab of WSe2 with the probe energy E = 1.61 eV and pump energy E = 1.56 eV (Supplementary Notes 5 and 7). a, b were collected with a pump power of 1.5 mW (see Supplementary Note 7 for fluence dependence). a Values of δq2 (blue dots) are displayed as a function of Δt. The solid blue line indicates the pump-probe convolution. b Values of δq1 (red dots) are extracted from the same dataset used in panel a. The solid green line is calculated from an Auger model (see Supplementary Note 9), while the blue line indicates the pump-probe convolution. The red line is the sum of the latter two functions. c, Lorentz model calculations of the dispersion relationship in equilibrium and non-equilibrium conditions (Table 1; Supplementary Note 8). The calculations show the equilibrium dispersion relationship (dashed black line) in the vicinity of the A-exciton, initially at energy Ex, (black dashed arrow). A non-equilibrium blueshift of the A-exciton10 to an energy Ex’ = Ex+7 meV (blue arrow) produces trend (I) (blue line). Bleaching of the A-exciton (see main text) produces trend (II) (red line). d The differential dispersion defined as the trend of δq1 = q1,p−q1,rvs. ω. The differential dispersion of the blue-shifted A-exciton10 produces the trend (i) (blue line). The differential dispersion of the bleached A-exciton produces the trend (ii) (red line), see main text. e The experimental differential dispersions were obtained at two-time delays Δt = 0 (blue dots) and Δt = 1 ps (red dots) with a pump power of 3 mW. The red and blue lines are calculations using the parameters reported in Table 1. Bleaching of the A-exciton, trend (ii), is prominent in Δt = 1 ps data (red line), while a blue-shift of the A-exciton, trend (i), plays a dominant role in Δt = 0 data (blue line). An approximately linear decrease of q1(E), produced by the decrease of ε*stat, is also included in the calculations at both time delays (black dashed line).

