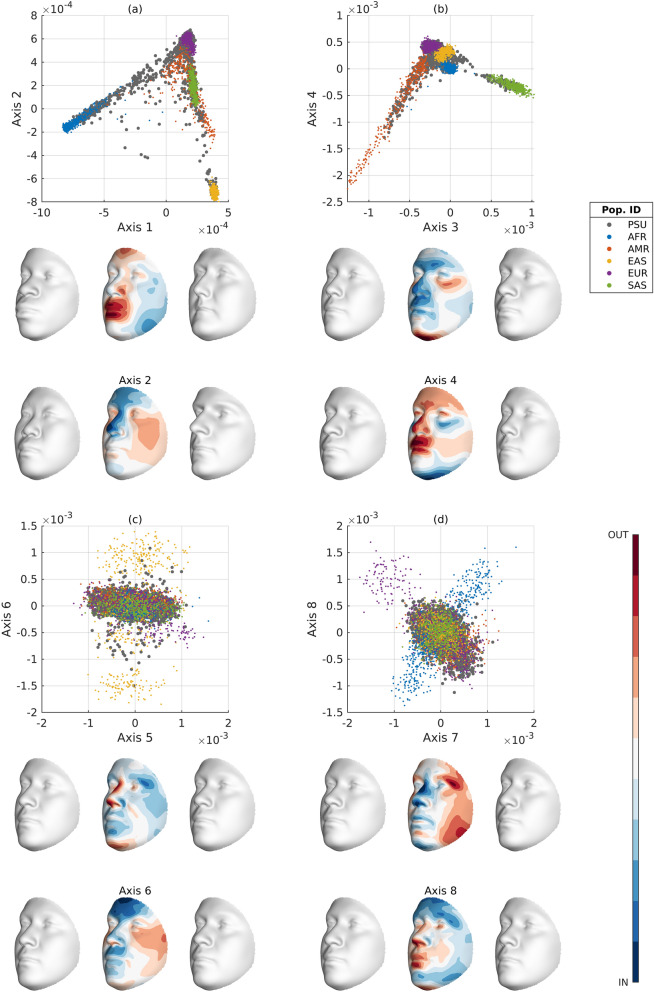
Figure 5.
Top eight SUGIBS axes of 1KGP and projections of the PSU cohort. (A) The first (horizontal) and second (vertical) axes. (B) The third (horizontal) and fourth (vertical) axes. (C) The fifth (horizontal) and sixth (vertical) axes. (D) The seventh (horizontal) and eight (vertical) axes. Grouped populations of the 1KGP are coloured dots (AFR, African, AMR, Admixed American, EAS, East Asian, EUR, European, SAS, South Asian). The projected PSU cohort are represented by grey dots. The faces illustrate opposing variations along each of the ancestry components and are not associated to any of the 1kG populations in particular. For each axis, we visualize a face − (left) and + (right) 3 times the standard deviation (sd) from the 1KGP mean on that axis. In the middle, the blue-red colormap highlights inward (blue) and outward (red) facial difference going from the + 3 sd to the − 3 sd facial gestalts. The values for sex, height, weight and age were 1.5 (genderless), 165 cm, 75 kg and 30 years, respectively.

