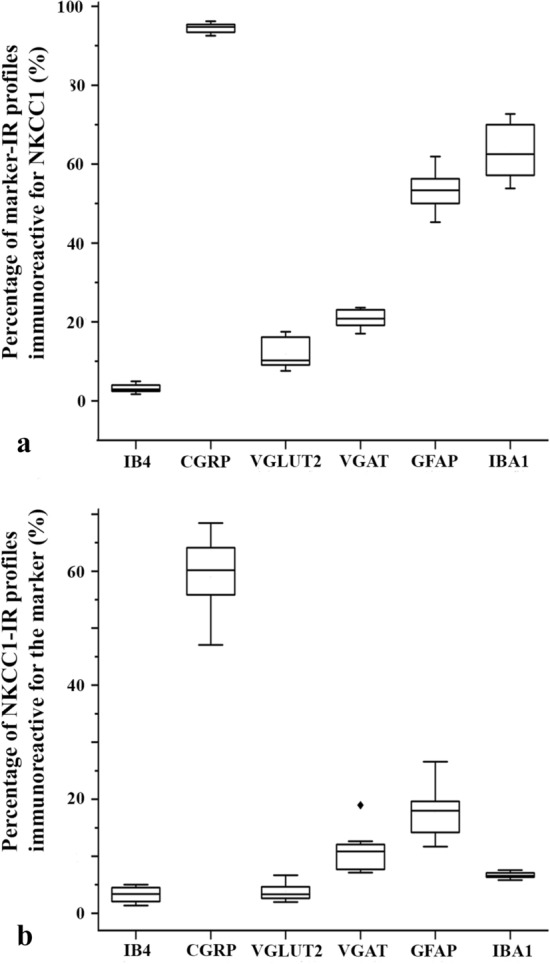
Figure 3.

Box plot histograms showing the degree of colocalization between immunoreactivity for NKCC1 and selected axonal and glial markers in laminae I–II of the spinal dorsal horn. (a) Percentage of profiles immunoreactive for the applied axonal and glial markers that were also labeled for NKCC1. (b) Percentage of profiles immunoreactive for NKCC1 that were found within the confines of areas immunostained for the applied axonal and glial markers.
