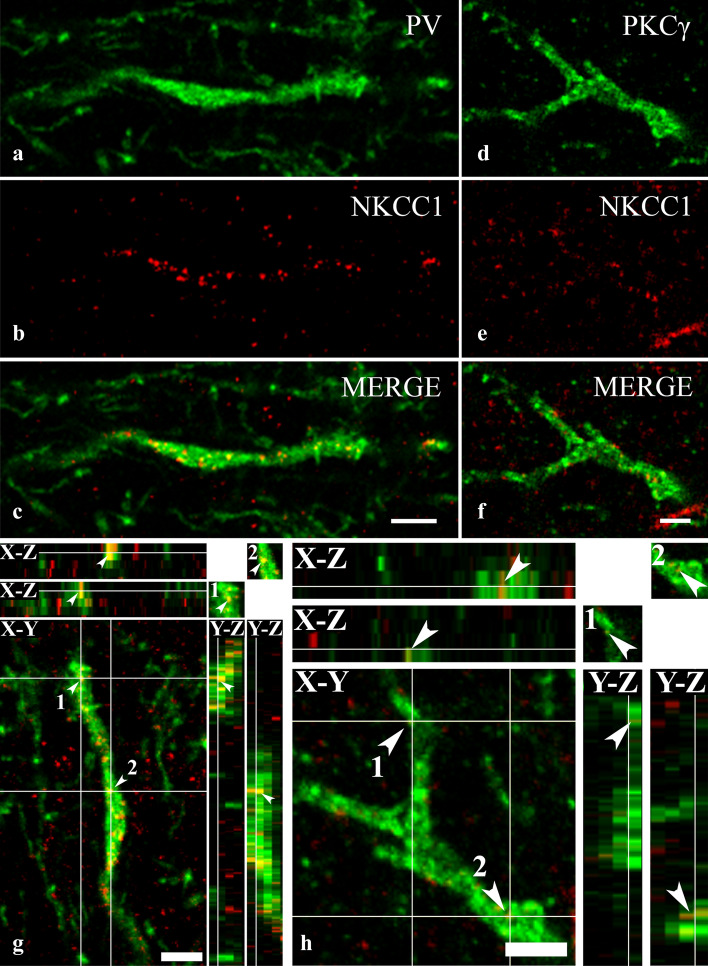
Figure 6.
Immunostaining for NKCC1 in dendrites of spinal neurons containing PV and PKCγ. Micrographs of 1 µm thick laser scanning confocal optical sections double stained for PV (a) and NKCC1 (b) and for PKCγ (d) and NKCC1 (e). Mixed colors on the merged images (c, f) indicate that NKCC1 is strongly expressed by dendrites of PV-IR dendrites (c), whereas NKCC1-IR puncta are only sparsely scattered over the PKCγ-IR dendritic segment (f). Micrographs of short series of confocal optical sections double immunostained for NKCC1 (red) and PV (green) or PKCγ (green) show the colocalization between NKCC1 and PV (g) as well as PKCγ (h) illustrated in X–Y, X–Z and Y–Z projections. Two selected points (labeled with 1 and 2) of colocalization between the markers are at the crossing point of two lines indicating the planes through which orthogonal views of X–Z and Y–Z projections were drawn. Small inserts in the upper right corner of both g and h show the selected two points in X–Y dimension without the lines. The corresponding X–Z and Y–Z projections are beside and below these inserts. According to the orthogonal images, as it is indicated by the mixed color (yellow), NKCC1 immunostained puncta 1 and 2 are within the confines of the PV as well as the PKCγ immunoreactive profiles. Scale bars: 5 µm (a–f), 2 µm (g, h).

