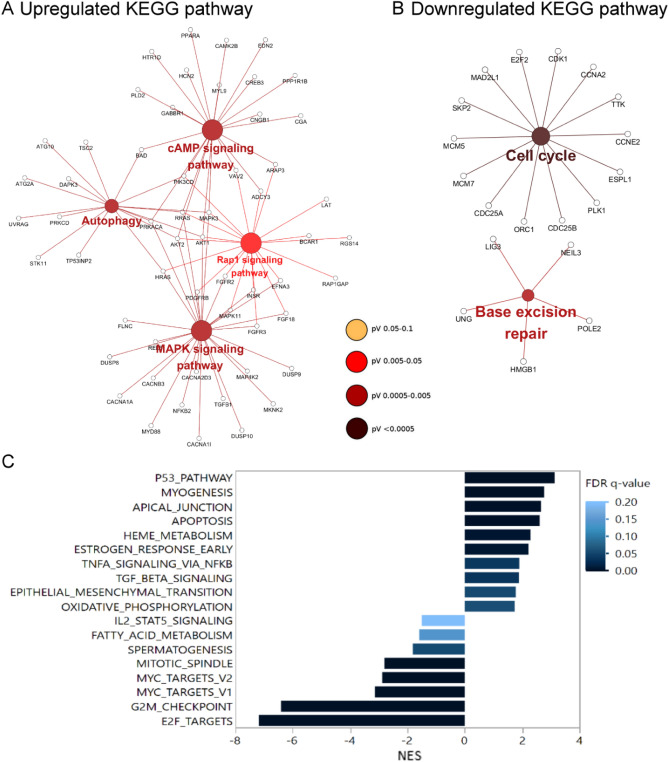
Figure 2.
Identification of functional pathways impacted by Zac1 overexpression using Cytoscape ClueGO and GSEA. KEGG pathways associated to upregulated DEGs (A) and downregulated DEGs (B) with mZac1 overexpression. Large circles represent correlated pathways and small circles indicate differentially expressed genes in the pathways. (C) Normalized enrichment scores (NES) of the enriched Hallmark gene-sets (P < 0.01, FDR < 0.2) associated with mZac1 overexpression in HeLa cells.

