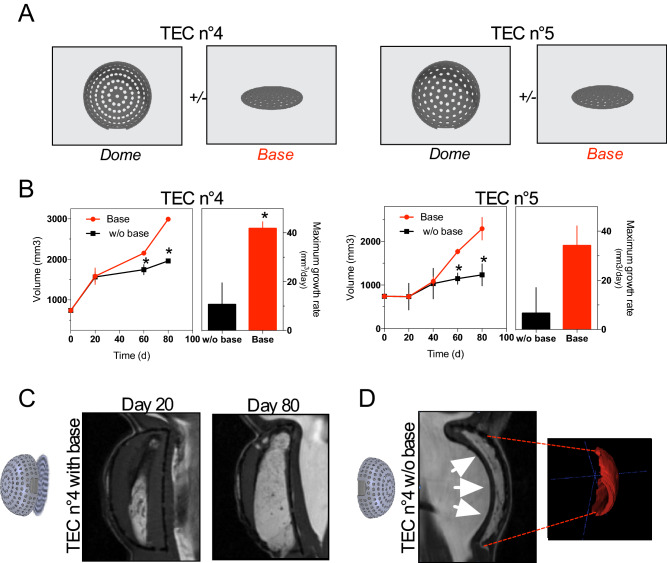
Figure 5.
Influence of a TEC base on fat flap growth (a) Diagram showing the description of TEC4 and TEC5. The two tissue-engineering chambers (TEC 4 and TEC 5) differ by their dome porosity but have an identical flat base; (b) Growth curves of fat flap in the presence of TEC4 (left panel) or TEC5 (right panel) with (red line) or without a base (black line). Alternatively, maximum growth rates are calculated. Volume is determined on MRI images by three independent examiners. Values are expressed as mean ± SD (n = 3). * p < 0.05; (c) Representative longitudinal Magnetic Resonance Imaging (MRI) data of TEC4 with a base at day 20 (left) and day 80 (right) after implantation; (d) Representative longitudinal MRI data (left) and 3D modeling of fat flap (right) under TEC4 without a base at day 60 after implantation. White arrows show host tissues that fill the chamber impeding growth of the fat flap.

