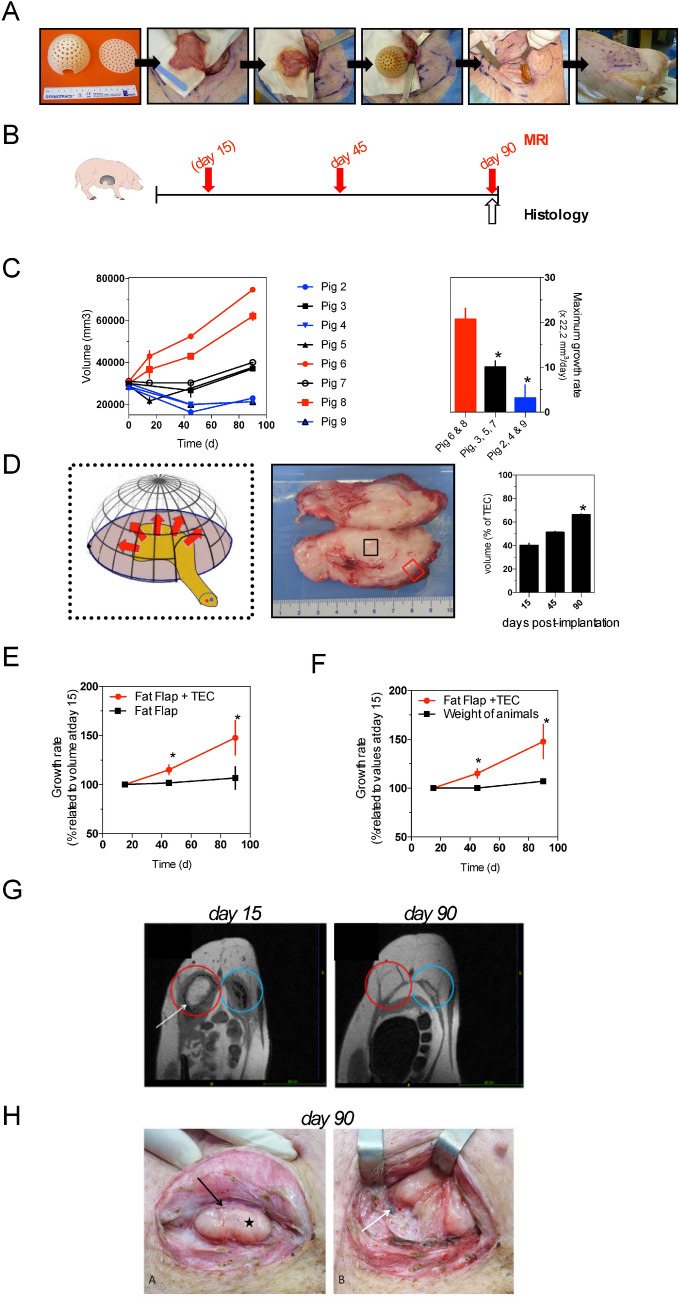
Figure 6.
In vivo growth of fat flap under bioresorbable TEC (a) Surgical procedure of implanting the TEC in pig. The PGS growth chamber comprised of a flat base and a perforated dome-shaped lip. (Note the hole on the dome for the insertion of the pedicle vessels); lifting the pedicled adipose flap suture of the flap onto the base of the TEC with threads; suture of the dome on the base with threads; transferring the TEC and flap in the subcutaneous pouch and fixing on the underlying muscular aponeurosis; immediate postoperative aspect after watertight closure on 3 planes; (b) Experimental design: schematic depicting the follow-up of pigs implanted with bioresorbable multiperforated TEC (TEC 6 see Table 2) by MRI and histological evaluations at the indicated timepoints (MRI were performed at day 15 only for pigs 5, 6, 7, 8 (c) MRI quantitative analysis of in vivo growth kinetics of adipose tissue within bioresorbable TEC. Results are expressed as means ± SD in 8 pigs. Depending on growth rates we grouped pigs into 3 groups (Pigs 6 & 8, pigs 3, 5 and 7, pigs 2, 4 & 9). * p < 0.05; (d) Drawing of the set-up showing the pedicled adipose flap (yellow) inserted in the TEC in order to obtain adipose growth (red arrows); Gross morphology of the fat flap after insertion in the TEC; cross sections of fat tissues at day 90 after implantation. Note capsule of fibrovascular tissue at the peripheral of the TEC; Growth of adipose tissue within the bioresorbable TEC at days 15, 45 and 90 after implantation in pigs (n = 8). Results are expressed as means ± SD of percentages of the theoretical volume within the TEC * p > 0.05; (e) Comparison of relative growth rates of fat flap within the bioresorbable TEC and without the TEC. Results are expressed as means ± SD; (f) Comparison of relative growth rates of fat flap within bioresorbable TEC and weight of pigs. * p < 0.05; (g) MRI images in axial sections (T1 3D sequences) of fat flap within the TEC at day 15 (left panel) and day 90 (right panel). The fat flap within the TEC (red circle) is in hypersignal T1 with the TEC (white arrow, TEC visible at day 13 and not at day 83) being resorbed around it. In pig 6, an empty TEC without flap (blue circle) was used as control. Note the empty TEC without flap being resorbed then disappeared at day 83 leaving place to fibrosis; (h) Photograph showing a 90-day fat flap specimen (black star) within the bioresorbable chamber. Note that resorption was complete for the dome though some parts of the base had remained (white arrow). The figure was produced, in part, by using Servier Medical Art https://smart.servier.com/.

